Here is a timely story, given that we set our clocks back over the weekend for Daylight Saving Time. NPR had a segment this morning titled “Study Sheds Light on Criminal Activity During Time Change“, about a statistical study by two social scientists which indicates that the Daylight Saving time change leads to an increase in crime.
If you’re interested:
- Listen to the 4-min NPR segment:
- Read this phys.org summary of the study. An excerpt:
Researchers are no longer in the dark about when criminals are most likely to attack. William & Mary economist Nicholas Sanders teamed up with the University of Virginia’s Jennifer Doleac to study the connection between Daylight Saving Time and criminal activity. They found that when it comes to crime, that one-hour shift makes all the difference.
Sanders, assistant professor of economics, explains that it’s axiomatic that some criminal activity is highest when it’s dark. Whether they know it or not, the trip home for commuters is riskier during the winter months, as deepening dusk makes them easy targets for muggers and other robbers.
But just how big is the Daylight Saving effect? To answer the question, Sanders and Doleac focused on the hour where daylight is most affected by Daylight Saving Time. They used data from the National Incidence-Based Reporting System (NIBRS) to track hourly crime rates over the course of the three weeks prior to and following the day on which we set the clocks ahead. Sanders and Doleac found that robbery decreased by 40 percent in the hour most impacted by Daylight Saving Time—that hour that was dark or twilight in Standard Time, but is still daylight when DST kicks in.
- If you’re really interested, take a look at Sanders and Doleac’s paper, “Under the Cover of Darkness: Using Daylight Saving Time to Measure How Ambient
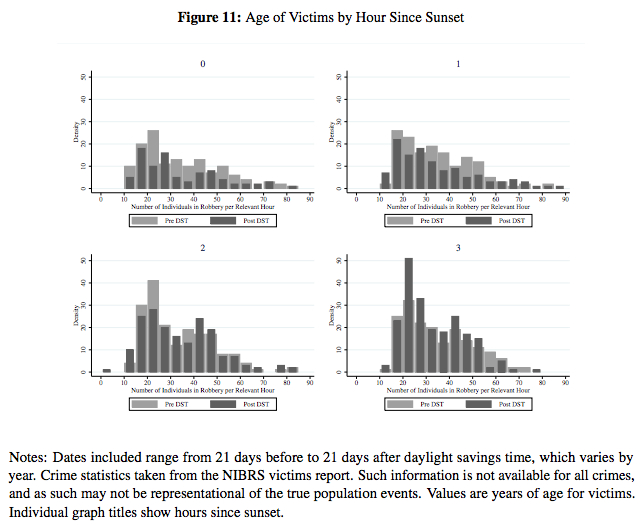
Light Influences Criminal Behavior” [pdf].In particular, look at Sections 4 (“Data”) and 5 (“Empirical Strategey”), and also some of the figures.For example, shown below is one of the figures consisting of a series of frequency distributions, which the authors discuss in the text of the paper as follows:Figures 9 through 11 show demographics of victims from reported crimes during the four hours after sunset, before and after DST….They fall for victims of most ages during hour 0, but increase particularly for victims in their 20s during hour 3. These graphs jointly suggest, to the extent that there is any increase in later-evening crime after DST, it particularly impacts young adults.


