Statistics deals with collecting and analyzing data, this broad concept can be applied to almost everything. When dealing with electricity it is very important to know how it is being used. For example, Con Edison receives massive amounts of data on how much power is being used by people. Based on these statistics it provides consumers feedback on how they can lower their energy bills and what home installations they can make to best suit their energy needs. On a larger scale, by looking at past trends utility companies such as Con-Edison can figure out times of peak demand and shortage. For example if on a rainy day in late may, it is found that there is a surplus of power. Based on statistical analysis from previous year’s data, Con Edison can figure out when will be the closest day of peak demand. If the closest day, is predicted to be 2 days from the rainy day then arrangements can be made to store the excess power temporarily. However if the statistics say that the next peak demand day will be 2 weeks from the rainy day then Con Edison will know that it is a lost cause because the power cannot be stored for such a long period of time. And it is best to use the power for internal operations rather than sell it to customers.
Author Archives: mohammede
Energy Graph
I received this graph from:
https://cleantechnica.com/2014/04/22/7-interesting-nuclear-energy-graphs/
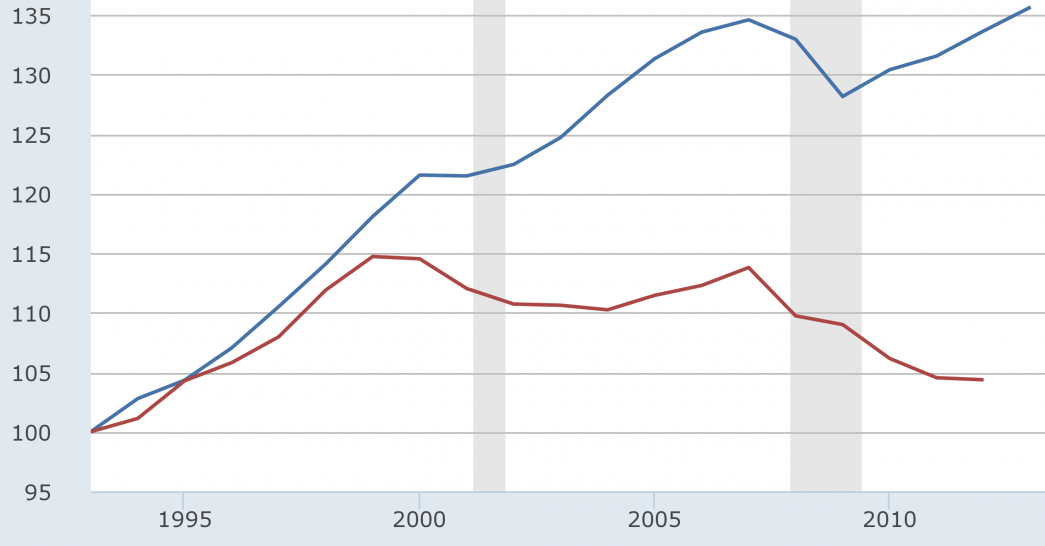
This graph shows us the electricity produced in TerraWatt hours in Germany from the year 1991-2012, either by Nuclear or by Renewable sources. We can see that the energy produced by nuclear has gone down in recent years while renewables has gone up almost linearly starting from the early 1990’s. The article cites that this chart, among others which were featured in the article, came from World Nuclear Report 2013.

Edit:
In reference to Ronald’s comment. From 2006 to 2012, a span of 6 years, Nuclear Energy consumption went down 67 TWh. We can say say this because 167-100 TWh= -67 TWh. 2012 to present is 6 years, that is another 67 TWh consumption has gone down. So we can say that from 2012 to present NE consumption has gone down 67 TWh.


