My first semester of statistics was a very interesting experience. In the beginning it started out simple with some of the concepts that I had learned in high school. After a a few weeks it started to get a little challenging with all of the concepts like Poisson distribution and T-distribution. At that time these concepts were new to me but now I am familiar with them thanks to professor Halleck and his power point slides. I also learned about excel as well which will definitely come in handy in the workplace, in other classes and in daily life. Now that the semester is over I plan on strengthening my probability skills over the summer to prepare me for my next statistics class and computer science class. I hope that I get a good professor like professor Halleck.
Category Archives: Uncategorized
Statistics and Probability
My experience in this course was a very positive one. I’ve learned how to find and assign probabilities to events by using condition probability and using the counting methods. I also learned how to determine whether or not data supports a hypothesis or claim with a certain alpha level by finding the z score and p value and seeing how it related to the alpha level. Overall, I learned the importance of collecting, analyzing, and interpreting data as well as how to draw conclusions from the data being examined. I can use what I learned and apply it to the field of telecommunications.
Cars vs. Public Transportation
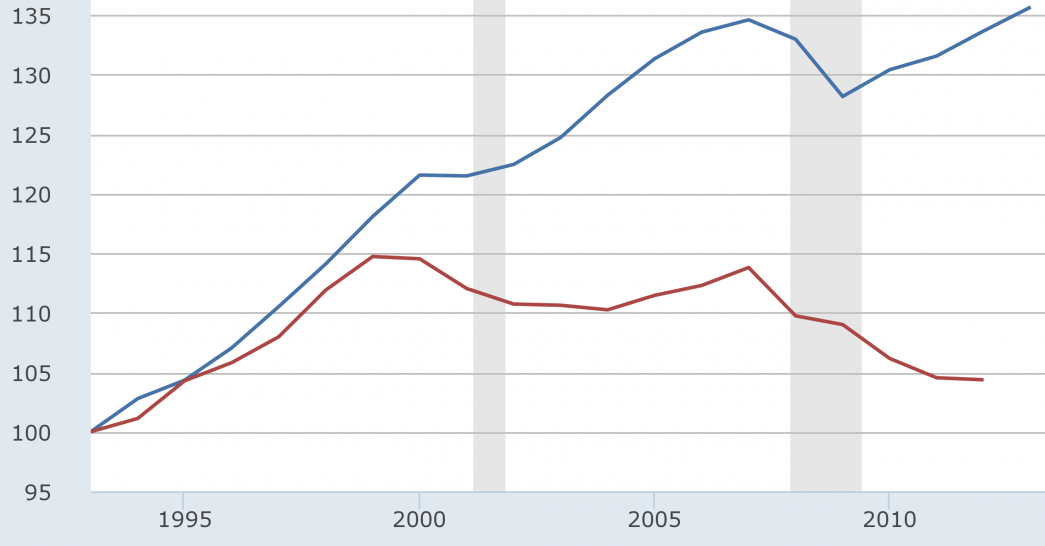
One of the more polarizing debates is whether or not it is safer to travel by a car or other forms of transportation which includes train, bus, etc. It is known that about 1.3 million people die on road crashes every year. However, there is still a fear or doubt of public transportation that people have in likelihood because of how accidents relating to public transportation are covered. There are even some countries that have made mass transit an aspect of life. This graph shows the fatalities of people of take various forms of transportation. U.S analyst Todd Litman found that riding a commuter or intercity rail is 20 times safer than driving. He even cites research that shows that cities with higher transit ridership usually have a lower capita traffic fatality rates. https://cleantechnica.com/2015/01/05/truth-safe-transit-compared-driving/
Telecommunications and Statistics
Statistics and probability share a relationship with telecommunications. Telecommunications by definition is communication over a distance whether it is by means of a capable, telephone, or by broadcasting. In order to enhance the effectiveness in which signals are communicated, a collection and analysis of data would be needed. This analysis and the collection of data could include the strength of the signal as it pertains to where and its being transmitted and received. Data collection and analysis could be used to determine the cause and circumstances under which the signal you want to send goes through or not. Based on what you find, it can be determined what methods could be used to strengthen the signal.
How statistics relates to my major?
Hello, my name is Jahmar and I am a college student currently studying computer science. When it comes to computer science statistics is heavily involved. From probability to combinations and permutations. There are coding terms in the program C++ that refer back to some of these concepts especially like arrays and vectors. It is very important for me to firmly grasp the fundamentals of statistics so that I will be able to improve my understanding when it comes to data mining and machine learning. I hope that I can take the knowledge that I learn from this class and use it in my everyday life.
how statistic and probability relates to my major?
Hello0! my name is Karma Tsering. This is my first time taking Probability and Statistic course as a Computer Science student. This course relates to my majors in many ways. Statistic helps to store data and analyze the outcome of the data. Probability gives a percentage of a chance if an experiment is going to fail or succeed. This are crucial to Computer Science because it allows software engineers to write new codes or create new technology that can solve tasks more efficiently for example apps such as Facebook, and YouTube etc or devices like cellphone ,laptop etc. Software engineers can manipulate the outcome of the experiment by controlling the probability rate of success . These are all possible because of statistics and probability. Statistic and probability relates to anything that’s done more than once. Its a way to predict future based on past .
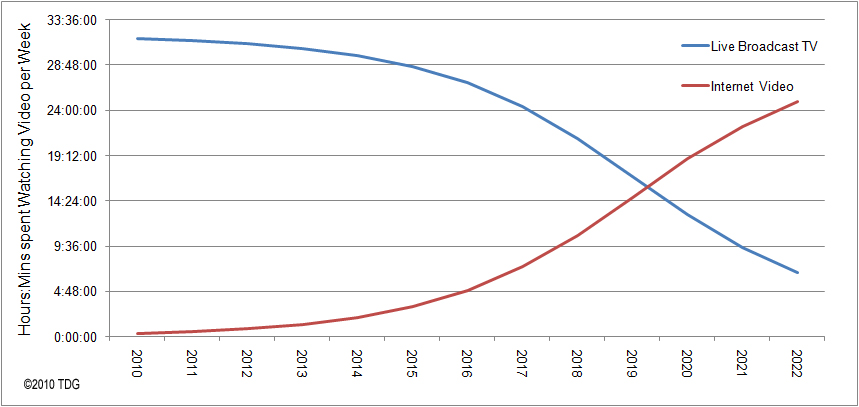
HOURS SPENT ON TRADITIONAL LIVE-TV VS THE ONLINE STREAM VIDEOS
The graph shows the up-rise of the Internet video and the downfall of live broadcast tv from 2010 to 2022. The trend line of the amount of hours people spend on live TV has decreased and the amount of hours people spend on Internet videos has increased over time. Its estimated that by 2019 the amount of hours spent on Internet videos will be same as the traditional Live TV. After 2019 the online stream videos will surpassed the Live TV. At this rate I think the online stream videos will completely eliminate the live Broadcast TV because nowadays majority live TV content can be watched on online stream however it can’t be done other way around. Online stream is way more easier and efficient. It expands peoples’ option to watch content.
How statistics relates to my major
Statistics deals with collecting and analyzing data, this broad concept can be applied to almost everything. When dealing with electricity it is very important to know how it is being used. For example, Con Edison receives massive amounts of data on how much power is being used by people. Based on these statistics it provides consumers feedback on how they can lower their energy bills and what home installations they can make to best suit their energy needs. On a larger scale, by looking at past trends utility companies such as Con-Edison can figure out times of peak demand and shortage. For example if on a rainy day in late may, it is found that there is a surplus of power. Based on statistical analysis from previous year’s data, Con Edison can figure out when will be the closest day of peak demand. If the closest day, is predicted to be 2 days from the rainy day then arrangements can be made to store the excess power temporarily. However if the statistics say that the next peak demand day will be 2 weeks from the rainy day then Con Edison will know that it is a lost cause because the power cannot be stored for such a long period of time. And it is best to use the power for internal operations rather than sell it to customers.
Newspaper chart about netflix
This article is about Netflix growth. One of the things was it beat analysts’ predictions about its subscriber growth. Netflix last year gained 26 million new subscribers which were 50% more than the previous year’s growth. The surprising fact was Netflix growth accelerating in already developed markets of it’s like the U.S.
There was a line graph in the article showing the net new streaming customers for the past 12 months to show that the rate of new customer acquisition is increasing recently.
Then there was another graph which showed the costs Netflix must run its business. It was a histogram. It shows that Netflix’s cost is rising, so it needs to increase its customer growth accordingly.
Article Link : https://www.bloomberg.com/gadfly/articles/2018-04-16/netflix-earnings-don-t-worry-keep-spending
Introduction: Huzaifa Anas
Hello! My name is Huzaifa Anas. I am a freshman and pursuing a degree in biomedical informatics. Statistics and probability are very important for my major and career. In biomedical informatics, we are working with a large amount of data. To get anything out of the data we need statistics and probability to see if there are trends or relationships amongst the data from where we can derive some meaning. For example, if we have a group of people with heart disease before the age of 50 we can analyze their DNA to see what they have in common and then see if it statistically significant what they have in common. With this then we can draw conclusions and seek out casualty in the data of a certain gene and early heart attacks. This is just one example of biomedical informatics applying statistics. We also have things like artificial intelligence. IBM Watson is based on biomedical informatics. Its algorithm matches symptom’s and patient’s history to form a diagnosis. It looks at what the problem is and based on what the patient has given’s probabilities of different causes. These two are just one of the things which really catch my interest, but because biomedical informatics deals with a large amount of data you can say it is a specific field of applied statistics essentially.


