MAT1372 Statistics with Probability, SP2018
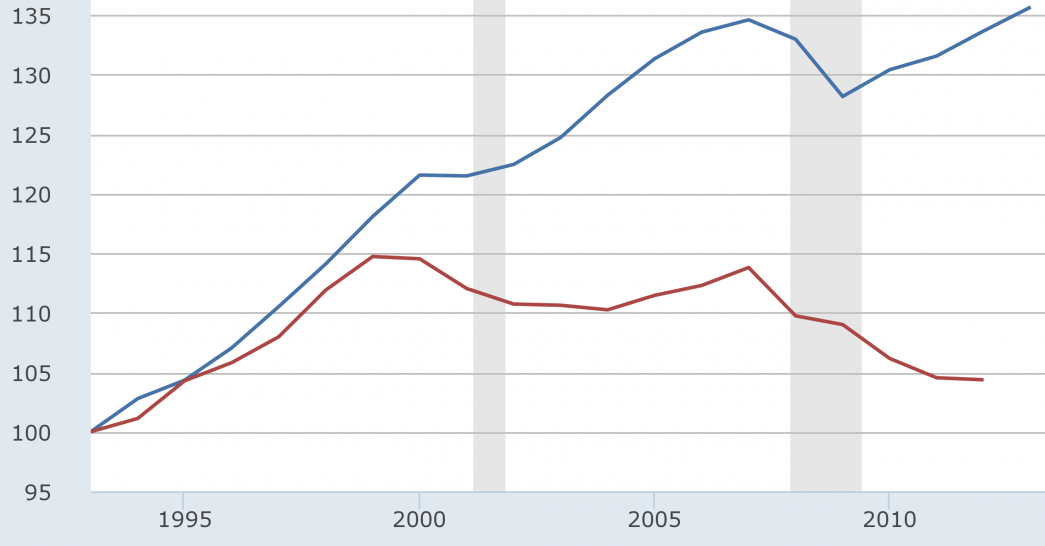
US: blue is gdp/population, red is median household income, both in constant dollars and indexed from 1993


Our goal is to make the OpenLab accessible for all users.
Our goal is to make the OpenLab accessible for all users.
Insightful graph representing lines for internet usage and TV usage. At some year, we will see the lines intersect or the TV usage being the same as internet usage. I would suggest maybe predicting when this will be.
Question: What is the slope for each of the trend-lines, and can you interpret this into words. What would the correlation coefficient(r) be as well as r^2?