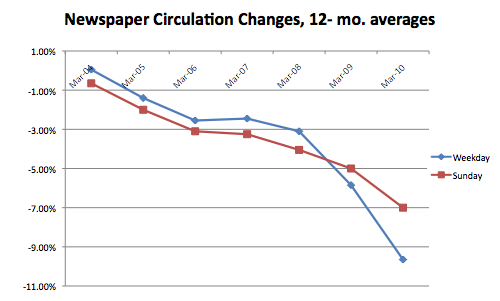
These Graph show the circulation change of a newspaper during week days and during weekends. The blue graph show the change during week days and the red one is for Sunday
Link: http://www.writeopinions.com/newspaper-circulation

These Graph show the circulation change of a newspaper during week days and during weekends. The blue graph show the change during week days and the red one is for Sunday
Link: http://www.writeopinions.com/newspaper-circulation

Statistics and Probability will help me solve these following problems in Electrical Engineering and Technology
The OpenLab is an open-source, digital platform designed to support teaching and learning at City Tech (New York City College of Technology), and to promote student and faculty engagement in the intellectual and social life of the college community.

