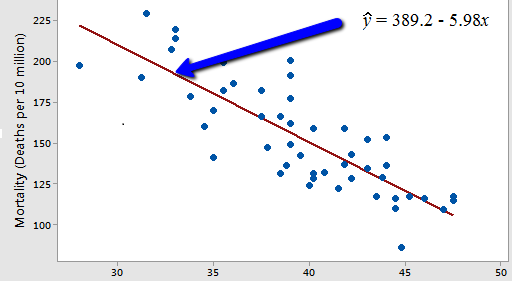
This semester has taught me that statistics is more then just number and data. It thought me how to analyze which direction datas provided skews to by analyzing the mean and medium. I learned how to get the min, Q1, medium, Q3 and maximum. I also learned how to get the standard deviation as well as the r and r^2 which is very important in statistics and helps you read data much clear. This gave me a great perspective about what statistics is about and a great experience for me to proceed with my educational career.
Monthly Archives: December 2018
Final Post
The topics that were taught in this course will be crucial in my academic journey ahead as well as my career. Analyzing data, predicting outcomes and noticing correlations are important tools that I will need in my field.
Final Post
This semester I learned a lot of topic that I had never known before like the standard deviation on excel and R, sample mean, and learning R codes from data-camp. I think the topics that I had learn will be useful for my future courses.
Final Post
In statistics one must learn to live with uncertainty. That is the most outstanding difference that I found with other math courses. At the beginning of the course I used to grab a formula and simply apply it when I did not understand something. But understanding each statistic and concept that is part of a formula gave me at the same time, a global view of things and how important is a look at detail. I learned not to fear the formulas but I do not have to use them automatically either. I learned that behind those things that I mechanically made when entering Excel data and getting results, I must understand the mechanisms that lead to the results. Finally, probability is nothing more than evaluating all possibilities. Things do not happen just because, there are a lot of situations that had to be given to make it happen
Final Post
This semester I learned about standard deviation, chi square, sample mean, and a bit of R code. I would use these lesson when I have to code statistics in my future job.
Final Post
This semester I’ve learned about binomial Distribution, Continuous Random Variable and Chi-square. I am able to use excel properly. Also,datacamp would helped me in other classes.
Final Post
Hey everyone,
Throughout the semester I’ve learned about sample space, expectation and variance, and also binomial. We are also doing a project about comparing 2 numeric variables and we are going to present it tours the end of the semester. I was able to use excel properly since I’ve never used excel in my life, so this class helped me with the fundamental of using excel.
Final Post
Hi everyone
Throughout this semester, by taking statistics and others biomedical courses such as Health care management, I understood that statistics play an important role in the biomedical field and I learned the relationship between statistic and biomedical information. Descriptive or elementary knowledge of statistics is needed for informatics research such as decision support system evaluation, understanding the barriers to electronic medical record implementation, information retrieval, summarization of phylogenetic analysis, or spatial clustering for outbreak detection. Knowledge of statistics is important not only for those conducting research studies, but also for understanding the findings in the biomedical informatics literature and scientific presentations. Now I see why I need this statistics class in order to be able to take biomedical informatics courses such as Med and Bioinformatics. Statistics is an essential aspect of biomedical informatics.
Final Post
Hello,
My overall experience in this class made me realized how important statistics with probability is and how it can apply to my studies. As a biomedical informatics major, we have to use statistics and different types of programs to read and analyze data. The R program, although it was challenging, helped me in so many ways especially in my programming for biologist class. At one point in our class, we had to analyze DNA sequences to extract RNA sequence from a DNA template. So, the R commands can be used to make a lot of calculations and graphing. Although, I focused on a lot of python codes in some way or form the R codes triggered a recollection of python commands because of the similarities between the two programs. For example, to do a simple calculation in R such as > x <- c ( 6, 2, 9, 3, 12, 5, 11) \n > mean (x) 6.85 … although you can create a vector and call it in two commands, python allows you to do the same but adding a few more steps. If you were to find the mean using the above data you’ll have to create a variable using the data above. Then import x = statistics.mean(place_variable) then print (x). Printing “x” would allow you to find the mean. So, R is more easier and user friendly compare to python and that was one thing I admired about this class.
By Javana


