Hi everyone! Read through the material below, watch the videos, work on the Excel lecture and follow up with your instructor if you have questions.
Learning Outcomes.
- Determine if the data supports a hypothesis at a given significance level using known distributions.
Topic. This lesson covers: Chi-Squared Test for Independence – Contingency Table
- Openstax Introductory Statistics
- Introductory Statistics by Sheldon Ross, 3rd edition: Section 13.3
- Statistics with Microsoft Excel by Beverly J. Dretzke, 5th ed., CHIDIST(x,df), CHIINV(p,df) P. 249 – 255
WeBWorK. Set 11.3
Videos
The Applied View
Watch the video Inference for Two-Way Tables.
- What type of research is the host of this series, Dr. Pardis Sabeti, involved in?
- Dr. Sabeti’s work is modeled off of work done on malaria. What genetic mutation is an important source of resistance to malaria?
- What were the null and alternative hypotheses for testing whether the sickle cell gene protects against malaria?
- What is the rule for calculating the expected counts under the null hypothesis?
- The p-value of the chi-square test statistic turned out to be approximately 0. What can you conclude based on this p-value?
Exit Ticket
The following contingency table presents data from a sample of a population that is characterized in two different ways:
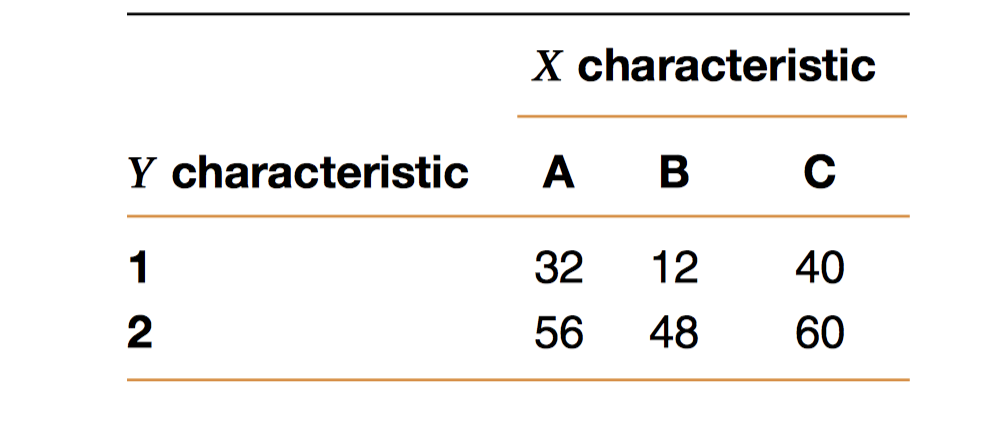
- Determine the value of the test statistic when testing that the two characteristics are independent.
- Would the null hypothesis be rejected at the 5 percent level of significance?
- What about at the 1 percent level?

