Hi everyone! Read through the material below, watch the videos, have fun with your labs and follow up with your instructor if you have questions.
Topic: Sample Mean and Distribution of Sample Means
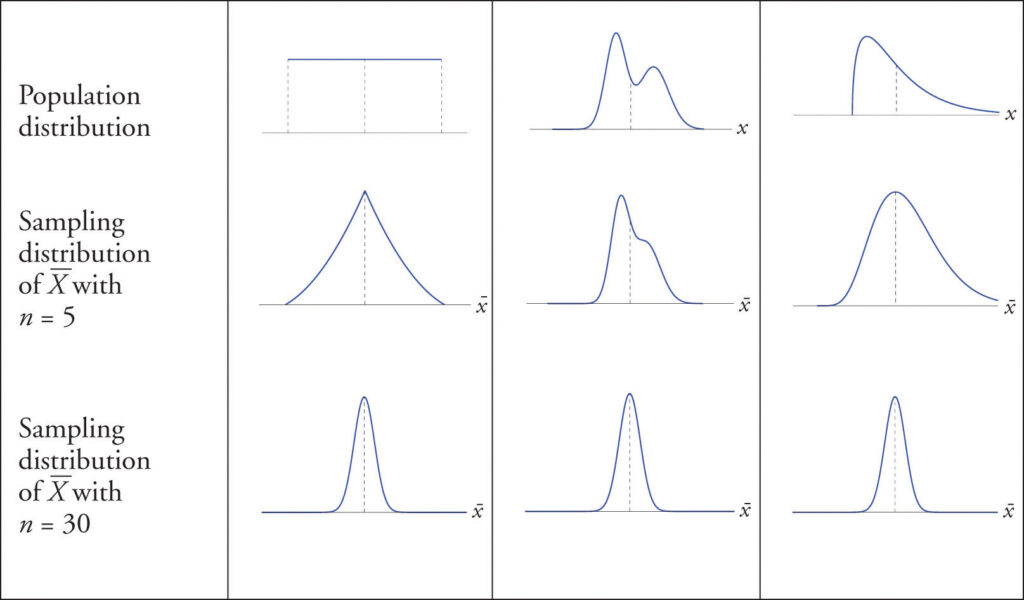
We frequently want to know a parameter for a population, such as the mean of a variable, but collecting data for each member of the population is often impractical. However, to get a good estimate of this value, it suffices to study just a sample. The Central Limit Theorem (CLT) is the theoretical tool that allows us to provide an estimate of the population parameter using the sample statistic. The estimate will always include “wiggle room” that depends on the size and variability of the sample.
For instance, in the media, you may hear something like “Mayor Garcia has the support of 55% of her adult constituency plus or minus 2%”. What is meant is that a poll was taken using a sample and that, with high likelihood, her actual support is in the interval from 53% to 57% .
- Openstax Introductory Statistics:
- Introductory Statistics by Sheldon Ross, 3rd edition: Section 7.3 & 7.4.1
WeBWorK. Set 7.1
<strong>Learning Outcomes</strong>
- Recognize that point estimates (such as the sample proportion) will vary from one sample to another, and define this variability as sampling variation.
- Note that when the population proportion $p$ is not known (almost always), this can be estimated using the sample proportion, $SE = \sqrt{\frac{\hat{p}(1-\hat{p})}{n}}$.
- Standard error measures the variability in point estimates from different samples of the same size and from the same population, i.e. measures the sampling variability.
- Recognize that when the sample size increases we would expect the sampling variability to decrease.
- Conceptually: Imagine taking many samples from the population. When sample sizes are large the sample proportion will be much more consistent across samples than when the sample sizes are small.
- Mathematically: $SE = \frac{SD}{\sqrt{n}}$, when $n$ increases, $SE$ will decrease since $n$ is in the denominator.
- Notice that sampling distributions of point estimates coming from samples that don’t meet the required conditions for the CLT (about sample size and independence) will not be normal.
- Define sample statistic as a point estimate for a population parameter, for example, the sample proportion is used to estimate the population proportion, and note that point estimate and sample statistic are synonymous.
- Calculate the sampling variability of the proportion, the standard error, as $SE = \sqrt{\frac{p(1-p)}{n}}$, where $p$ is the population proportion.
Common Resources
intro stax
openintro
videos
R-based Resources
Header text
Header text
The Applied View
Watch the video Sampling Distributions.
- What is the difference between parameters and statistics?
- Does statistical process control inspect all the items produced after they are finished?
- The inspector samples five circuit boards at regular intervals and finds the mean solder quality score x for these five boards. Do we expect x to be exactly 100 if the soldering process is functioning properly?
- If the quality of individual boards varies according to a normal distribution with mean µ = 100 and standard deviation σ = 4, what will be the distribution of the sample averages, x? (Recall the sample size is n = 5.)
- In general, is the mean of several observations more or less variable than single observations from a population? Explain.
- The distribution of call lengths to a call center is strongly skewed. What does the Central Limit Theorem say about the distribution of the mean call length x from large samples of calls?
Watch the video Control Charts.
- What was W. Edwards Deming known for?
- What is a process, statistically speaking? Give an example.
- What does it mean for a process to be in control?
- Why did Quest Diagnostics’ lab need a statistical-quality-control intervention?
- In Quest’s control chart, how did they determine where to set the upper and lower control limits?
- How did Quest respond to what it learned from its control charts? What were the results of these changes?
Exit Ticket
| The lifetime of a certain type of electric bulb has expected value 475 hours and standard deviation 60 hours. Determine the expected value and standard deviation of the sample mean of | |
| (a) 100 | |
| (b) 200 | |
| (c) 400 | |
| such lightbulbs. |

