OpenLab Logo
Home
About
People
Courses
Projects
Clubs
Portfolios
Help
Toggle navigation
My OpenLab
Home
About
People
Courses
Projects
Clubs
Portfolios
Help
Sign Up
Log In
MAT1372 Statistics with Probability, SP2018
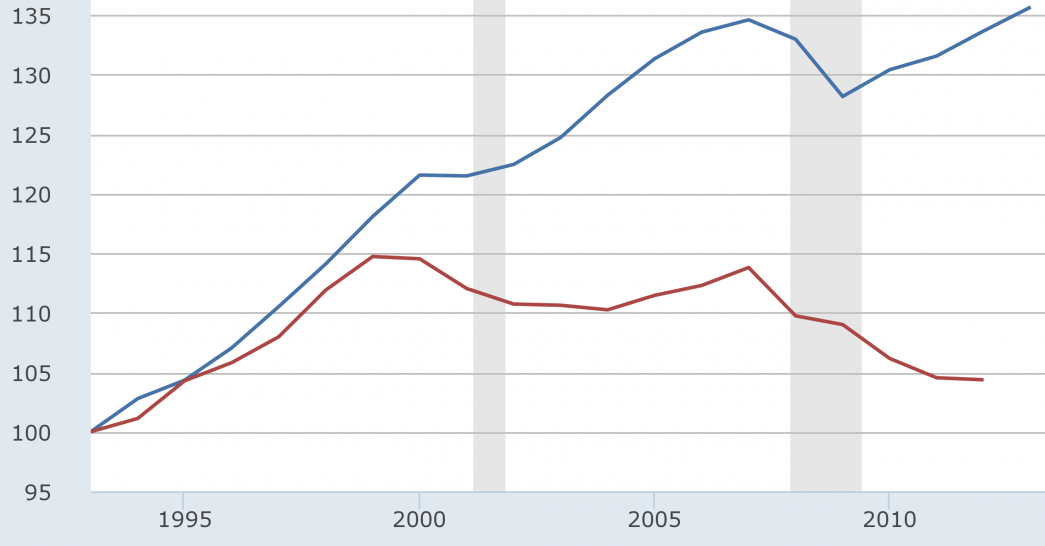
US: blue is gdp/population, red is median household income, both in constant dollars and indexed from 1993
Menu
Skip to content
Course Profile
Home
Assignments
classwk
Exams
Excel, Python and R
project
syllabus
Author Archives:
RonaldF
Daily Media Consumption
1 Reply
Average daily media consumption
MAT1372 Statistics with Probability, SP2018
Open Search
Search the OpenLab
Submit