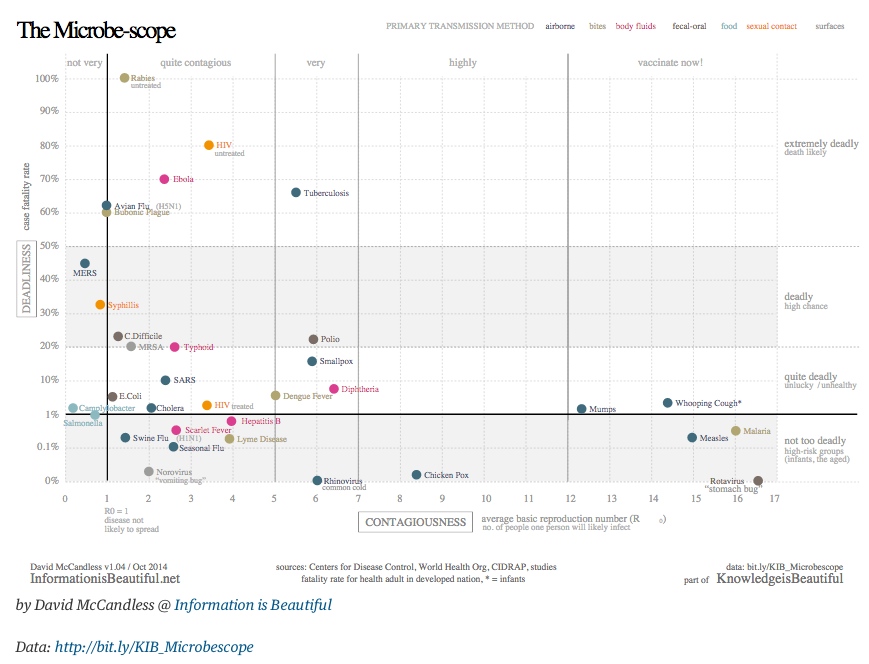
Here is the scatterplot from The Guardian Data Blog I showed briefly in class, which plots “deadliness” vs “contagiousness” for various infectious diseases:
Here, “deadliness” is measured by the average case fatality rate (the % of infectees who die) and contagiousness is measured by an epidemiological statistics called R0, the basic reproduction number.
Note that the data behind this scatterplot is available at http://bit.ly/KIB_Microbescope, in the form of a Google spreadsheet.


https://arstechnica.com/tech-policy/2015/09/att-accuses-employees-of-using-malware-to-mass-unlock-phones/