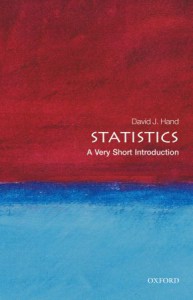
If you’d like to get a more conceptual overview of the topics we’re studying, you could take a look at this book:
The nice thing is that you can access an electronic copy of this book via the CUNY library–try this link.
Here is description from the publisher:
Statistical ideas and methods underlie just about every aspect of modern life. From randomized clinical trials in medical research, to statistical models of risk in banking and hedge fund industries, to the statistical tools used to probe vast astronomical databases, the field of statistics has become centrally important to how we understand our world. But the discipline underlying all these is not the dull statistics of the popular imagination. Long gone are the days of manual arithmetic manipulation. Nowadays statistics is a dynamic discipline, revolutionized by the computer, which uses advanced software tools to probe numerical data, seeking structures, patterns, and relationships. This Very Short Introduction sets the study of statistics in context, describing its history and giving examples of its impact, summarizes methods of gathering and evaluating data, and explains the role played by the science of chance, of probability, in statistical methods. The book also explores deep philosophical issues of induction–how we use statistics to discern the true nature of reality from the limited observations we necessarily must make.
Here is the author on the Central Limit Theorem (p73):
Imagine drawing many sets of values from some distribution, each set being of size n. For each set calculate its mean. Then the calculated means themselves are a sample from a distribution – the distribution of possible values for the mean of a sample of size n. The Central Limit Theorem then tells us that the distribution of these means itself approximately follows a normal distribution, and that the approximation gets better and better the larger the value of n. In fact, more than this, it also tells us that the mean of this distribution of means is identical to the mean of the overall population of values, and that the variance of the distribution of means is only 1/n times the size of the variance of the distribution of the overall population. This turns out to be extremely useful in statistics, because it implies that we can estimate a population mean as accurately as we like, just by taking a large enough sample (taking n large enough), with the Central Limit Theorem telling us how large a sample we must take to achieve a high probability of being that accurate. More generally, the principle that we can get better and better estimates by taking larger samples is an immensely powerful one. We already saw one way that this idea is used in practice when we looked at survey sampling in Chapter 3.
Here is another example. In astronomy, distant objects are very faint, and observations are complicated by random fluctuations in the signals. However, if we take many pictures of the same object and superimpose them, it is as if we are averaging many measurements of the same thing, each measurement drawn from the same distribution but with some extra random component. The laws of probability outlined above mean that the randomness is averaged away, leaving a clear view of the underlying signal – the astronomical object.


