Table of Contents
Applications of Spectrophotometry
Spectrophotometry can be used to determine the concentration of an unknown solution. First, a standard curve is created by using several solution of known concentrations. The absorbance for each concentration is measured and then plotted on a scatterplot to make a standard curve.
Watch the video below to review how to make a scatterplot with a trendline.
Once the trendline is added to the graph, you can have the software generate the equation of that line.
Using the Equation of a Line
The equation of a line is as follows:
y = mx + b
where m is the slope and b is the y-intercept.
The variables x and y represent plotted points along this trendline. When working with the spectrophotometer, x represents the concentration of the solution and y represents the absorbance at that concentration. Therefore, if we have a standard curve and know the absorbance of a solution of unknown concentration, we can use the equation of a line to calculate the concentration.
Practice: Calculate the Concentration of an Unknown Solution
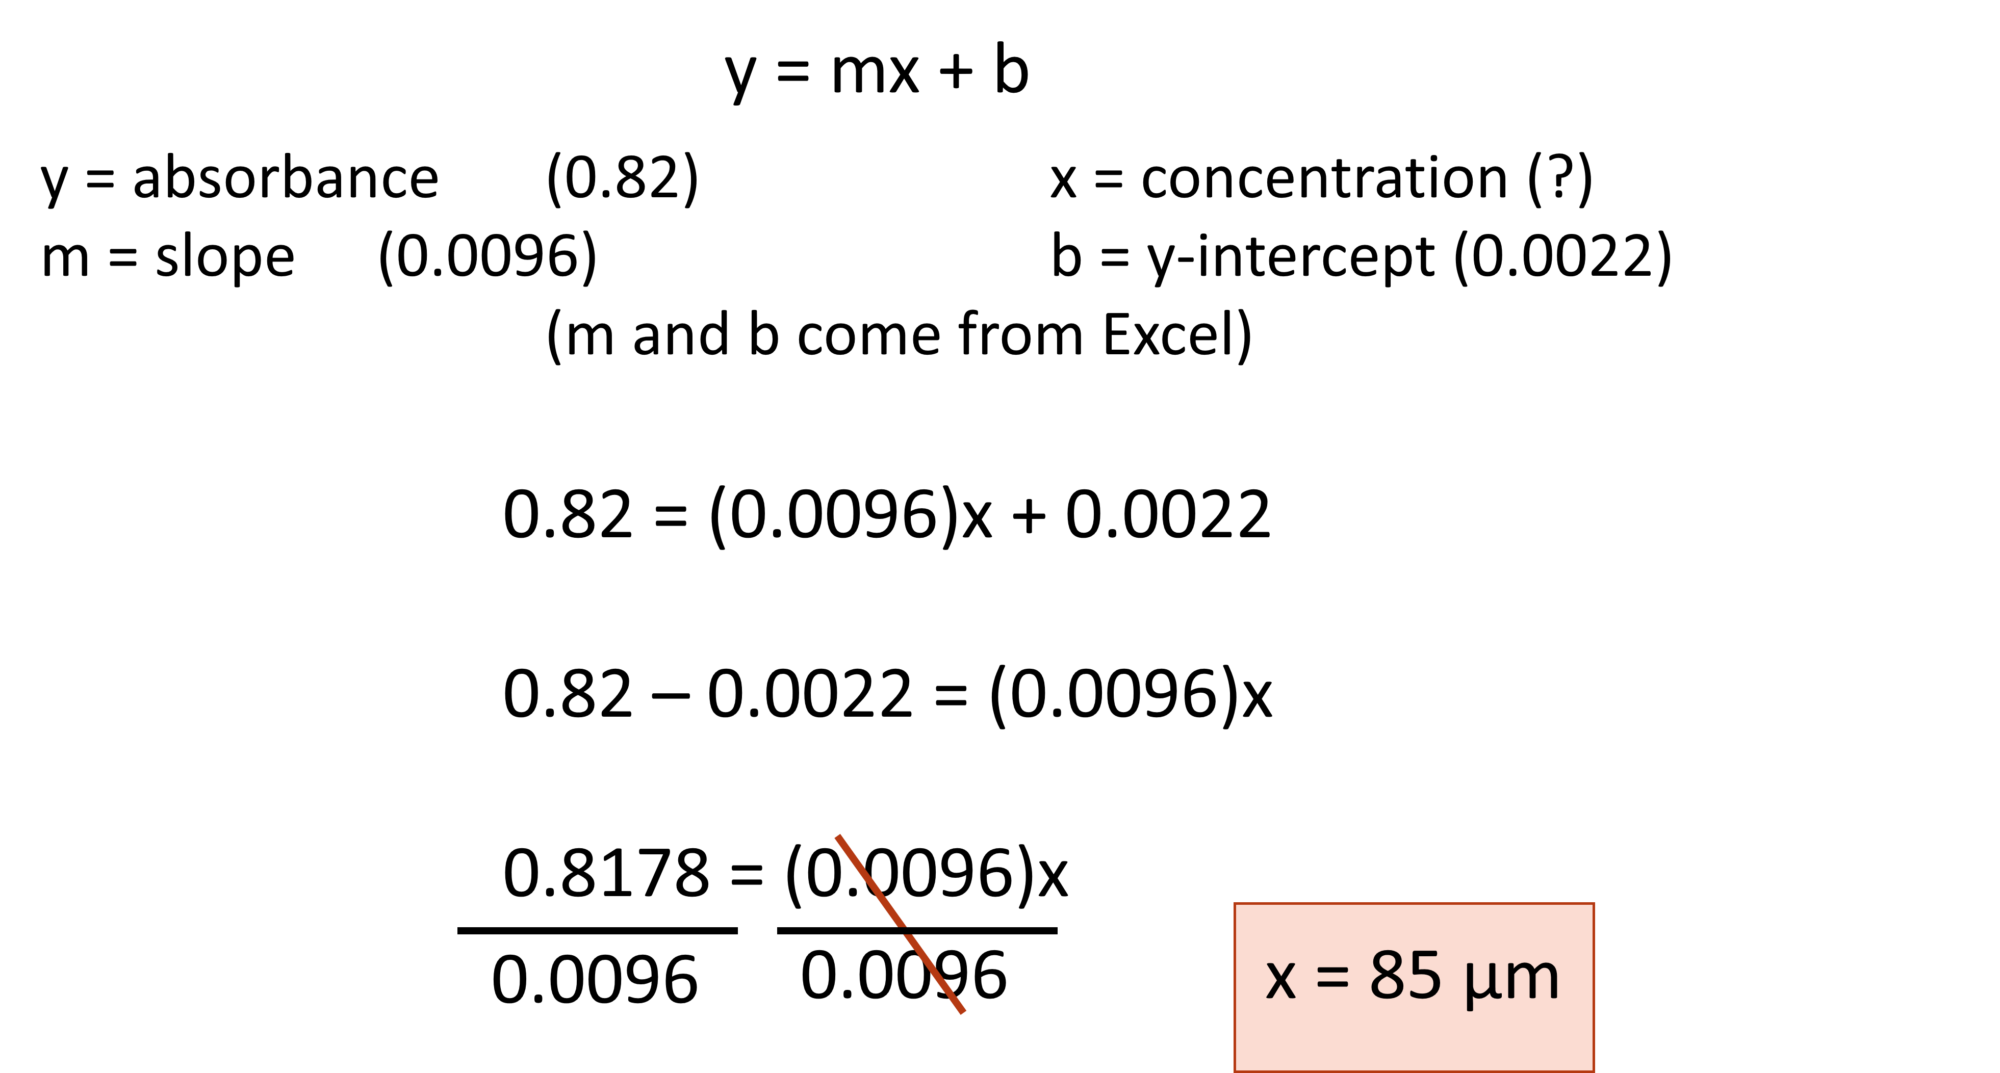
Question: A standard curve is generated for increasing concentrations of copper (II) sulfate. The equation of the trendline is y = 0.0096x + 0.0022. A solution of copper (II) sulfate of unknown concentration has a measured absorbance of 0.82. What is the concentration of this solution?
Solution: You need to solve for x. Remember: y is the absorbance which has been measured by the spectrophotometer.