Table of Contents
The Chi-Square Test
The χ2 statistic is used in genetics to illustrate if there are deviations from the expected outcomes of the alleles in a population. The general assumption of any statistical test is that there are no significant deviations between the measured results and the predicted ones. This lack of deviation is called the null hypothesis (H0). χ2 statistic uses a distribution table to compare results against at varying levels of probabilities or critical values. If the χ2 value is greater than the value at a specific probability, then the null hypothesis has been rejected and a significant deviation from predicted values was observed. Using Mendel’s laws, we can count phenotypes after a cross to compare against those predicted by probabilities (or a Punnett square).
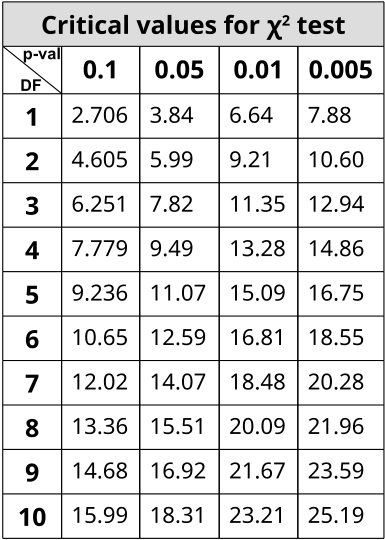
In order to use the table, one must determine the stringency of the test. The lower the p-value, the more stringent the statistics. Degrees of freedom (DF) are also calculated to determine which value on the table to use. Degrees of freedom are the number of classes or categories there are in the observations minus 1.
DF=n-1
In the example of corn kernel color and texture, there are four classes: purple & smooth, purple & wrinkled, yellow & smooth, and yellow & wrinkled. Therefore, DF = 4 – 1 = 3 and choosing p < 0.05 to be the threshold for significance (rejection of the null hypothesis), the χ2 must be greater than 7.82 in order to be significantly deviating from what is expected. With this dihybrid cross example, we expect a ratio of 9:3:3:1 in phenotypes where 1/16th of the population are recessive for both texture and color while 9/16th of the population display both color and texture as the dominant. 3/16th will be dominant for one phenotype while recessive for the other and the remaining 3/16th will be the opposite combination.
With this in mind, we can predict or have expected outcomes using these ratios. Taking a total count of 200 events in a population, 9/16(200)=112.5 and so forth. Formally, the χ2 value is generated by summing all combinations of:
(observed-expected)2/expected
Practice: Chi-Square
A scientist is working on a guinea pig breeding program. In guinea pigs, short fur (S) is dominant over long fur (s) and black eyes (B) are dominant over red eyes (b). The scientist breeds two individuals that have short fur and black eyes. The offspring are as follows:
- 145 have short fur and black eyes
- 52 have short fur and red eyes
- 44 have long fur and black eyes
- 9 have long fur and red eyes
The null hypothesis is that the traits are not linked. To test this, we need to use a chi-square.
Step 1: Figure out how many offspring there were in total.
- 145 + 52 + 44 + 9 = 250
Step 2: Calculate what the expected totals of each of the four types of offspring would be if the parents were dihybrids.
Use the 9:3:3:1 ratio. The offspring that look just like the parents are the “9”; the offspring that have only one trait in common with the parents are the two “3”s; the offspring that have nothing in common with the parents is the “1”.
To find the expected values, multiply the total number of offspring by the appropriate ratio (9/16, 3/16, 3/16, 1/16).

Step 3: Use the chi square formula to create the data that will be used to support or refute the hypothesis.
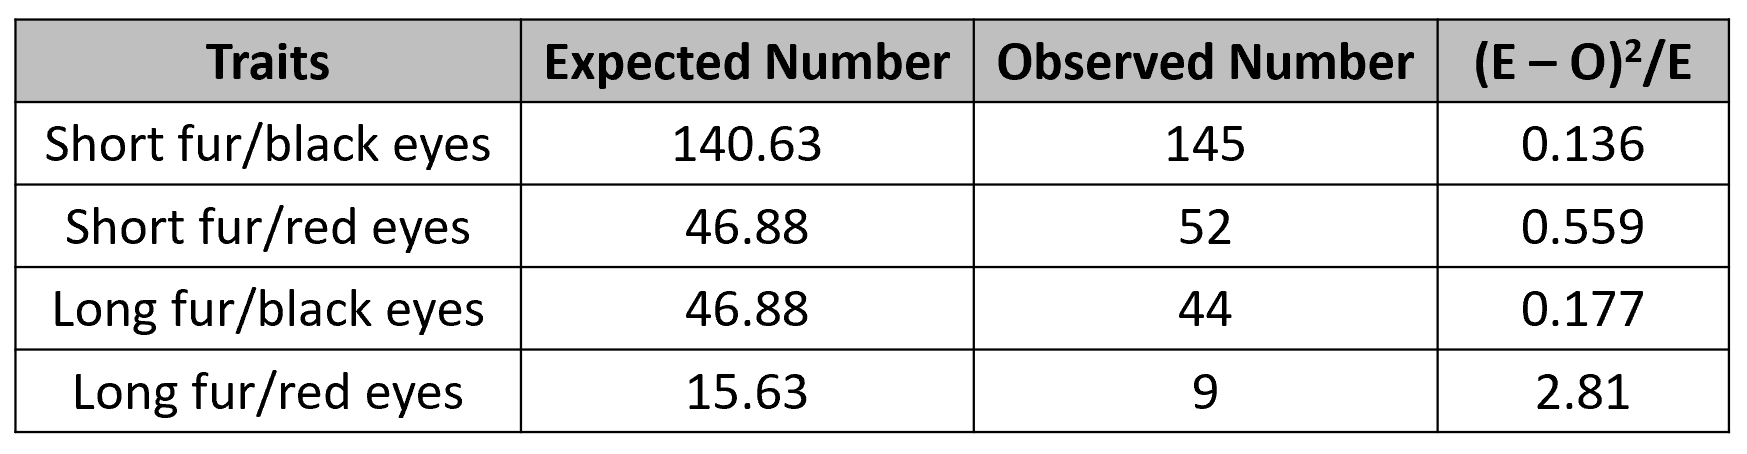
Step 4: Add the results from step 3 to get your critical value.
- 0.136 + 0.559 + 0.177 + 2.81 = 3.68
Step 5: Use the chi square table to figure out if your hypothesis is correct. The degrees of freedom is always the number of different groups minus one.
If the number you calculated in step 4 is lower than the value on the table, the hypothesis is correct. If your value is higher, the hypothesis is incorrect.

Look at the column for p>0.05. Since the critical value of 3.68 is less than 7.82, the null hypothesis is accepted. These genes are not linked.