Table of Contents
Observing Osmosis
Overview
In this activity, you will use bags made of dialysis tubing to explore how the tonicity of solutions can affect cells. Dialysis tubing is a semi-permeable membrane, just like the cell membrane. It allows small molecules and water to pass through, but prevents the movement of large molecules.
Materials
Each lab group will need the following materials:
- 4 pieces of water-soaked dialysis tubing (15 cm long)
- 8 pieces of string
- 4 small pieces of paper
- pencil
- 1% sucrose
- 25% sucrose
- 50% sucrose
- 2 large beakers
- paper towels
- balance
Method
- Obtain four pieces of water-soaked dialysis tubing 15 cm long and eight pieces of string. Seal one end of each tube by tying it with a piece of string. Make tight knots.
- Open the other end of the tube by rolling it between your thumb and finger.
- Write A, B, C, D on 4 pieces of paper using a pencil. DO NOT use ink.
- Insert the labels into individual bags.
- Fill the bags with the contents shown below.
- Bag A 10ml 1% sucrose
- Bag B 10 ml 1% sucrose
- Bag C 10 ml 25% sucrose
- Bag D 10 ml 50% sucrose
- For each bag, loosely fold the open end and press on the sides to push the fluid up slightly and remove most of the air bubbles. Tie the folded ends securely, rinse the bags, and check for leaks.
- Blot excess water from the outside of the bags and weigh each bag to the nearest 0.1 gram.
- Record the weights in Data Table 1: Weight of Dialysis Bags below.
- Place bags B, C, and D in a beaker filled with 1% sucrose. Record the time.
- Place bag A in an empty beaker and fill the beaker with just enough 50% sucrose to cover the bag. Record the time.

- Over the next hour, you will remove the bags from their beaker every 10 minutes for weighing.
- Remove the bags and weigh them one-at-a-time.
- Each bag should be blotted dry and weighed to the nearest 0.1 g.
- Handle the bags delicately to avoid leaks, and quickly return the bags to their respective containers.
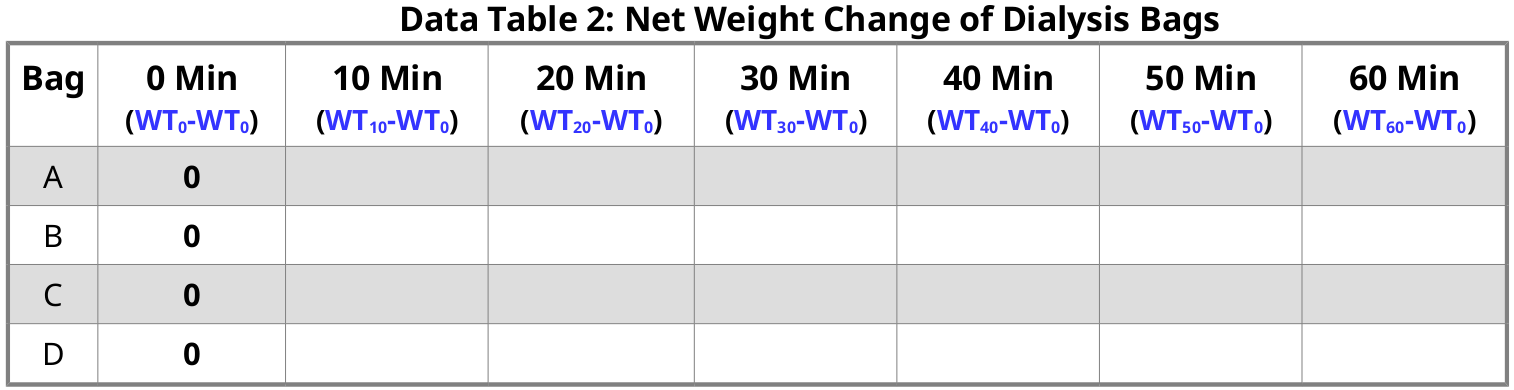
- For each 10-minute interval record the total weight of each bag and its contents in Data Table 1. Then calculate and record in Data table 2: Change in Weight of Dialysis Bags the change in weight from the initial weight.
- While you are waiting to weigh the bags, complete the table below with your hypotheses about the movement of the solutions.


- Plot your data using only the data from Table 2.
- Using a computer, create a scatterplot of the data from Table 2 and calculate the equation of the trendline.
- You should plot the data for all four bags on the same set of axes.
Conclusions
- Did your results match your hypotheses?
- What do the slopes of the lines generated from plotting the change in weight indicate to you?
- Can you analyze and articulate in words what has occurred with respect to these slopes?