Table of Contents
The Quantitative Detection of Proteins Using the SpectroVis
Overview
In this activity, you will use the SpectroVis spectrophotometer to determine the absorbances of increasing concentrations of bovine serum albumin (BSA). Bovine serum albumin (BSA) is a protein that circulates in the blood of cows. Purified BSA can be used with Biuret solution in serial dilutions to generate a standard curve. The standard curve will illustrate the relationship between concentration (the dependent variable) and absorbance at 540 nm (the independent variable). We can then use this curve to estimate the concentration of unknown samples at the end of this activity.
Materials
Each lab group will need the following materials:
- BSA solution
- water
- biuret reagent
- cuvettes
- water bottle with nozzle
- beaker
- 7 test tubes
- test tube rack
- wax pencil
- SpectroVis Plus spectrophotometer
- laptop
Before You Begin
Before performing the activity, discuss the following questions with your lab group:
- On a graph, do you remember which axis is the dependent and which is the independent variable?
- In the table below, can you identify which samples are the negative controls and which are the positive controls?
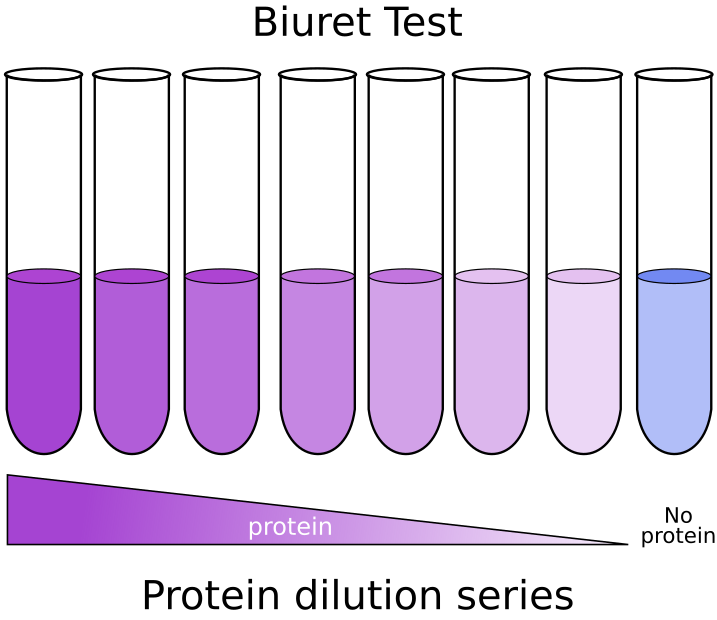
- What is the prediction of the absorbance or color intensity of the different tubes?
Method
Making the Standards
- Obtain 7 test tubes and label them A through G with the wax pencil.
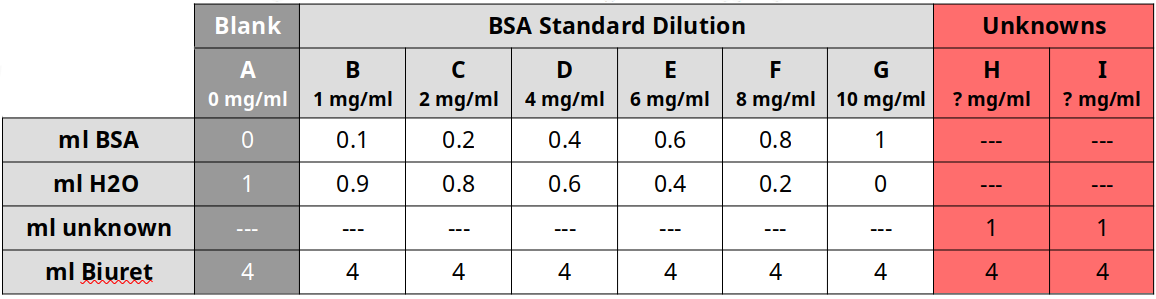
- Use Table 1 below to create the BSA standards. Ignore tubes H and I for now.
- Tube A is a blank, which means it contains just water and biuret reagent.
- Tubes B through G contain increasing amounts of BSA and decreasing amounts of water.
Setting Up the SpectroVis
- Connect SpectroVis Plus to computer via USB cable.
- Launch the Vernier Spectral Analysis program or Chrome App.
- Select “By Concentration (Beer’s Law)”.
- Wait while the lamp in the spectrophotometer warms up.
- After warm-up has completed, place a blank cuvette with a lid on it into the SpectroVis and select “Calibrate”.
- Select Wavelength to 540 nm and press “Done”.
- In the data table, click on “…” and change units to “mg/ml”.
- Remove the blank cuvette from the SpectroVis.
Getting Absorbance Data
- Place a sample from Tube A in the cuvette and place the lid on the cuvette.
- Place this cuvette in the SpectroVis and press “Collect”. After the absorbance value has stabilized, press “Keep”.
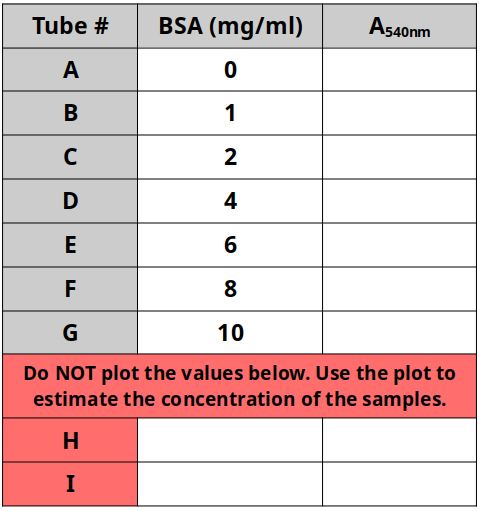
- Record the absorbance data in Table 2 below.
- Enter the concentration of the sample solution.
- Press “Keep Point”.
- Replace with a new sample solution and start from step 4 (“Collect”) for each new solution.
- Note that you need to rinse out the cuvette between each sample.
- Use the water bottle with the nozzle to wash the cuvette in the beaker.
Determining the Concentration of Unknown Solutions
Overview
Now that you have obtained the absorbances for known concentrations of BSA, you can use this data to determine the concentrations for unknowns. In this part of the activity, you will refer to the pink areas of the tables above.
Materials
Each lab group will need the following additional materials:
- 2 test tubes
- 2 random unknown tubes
Method
Absorbance of the Unknowns
- Each unknown tube has an ID label on it. Record these labels in your notebook.
- Follow the pink section of Table 1 above to make the two unknown tubes.
- Place a sample from Tube H in the cuvette and place the lid on the cuvette.
- Place this cuvette in the SpectroVis and press “Collect”. DO NOT press “Keep”,
- Record the absorbance data in Table 2 above.
- Rinse the cuvette and repeat Steps 19-21 with Tube I.
Making a Scatterplot
- Using Excel or Plot.ly, make a scatterplot using the data from the BSA samples of known concentrations (the standards). Include a line of best fit.
- Use the graphing software to obtain the equation of the line of best fit.
- Use this equation to determine the concentrations of each unknown sample.
- You can review how to do this here.