Table of Contents
Titration of Antacid
Inquire!
Discuss the following with your lab group:
- What pH do you predict an antacid to be?
- Do you expect the antacid to be a strong acid, weak acid, strong base, or weak base?
- Does brand of antacid matter in the effectiveness?
Overview
In this part of the activity, you will perform titrations on two different brands of antacid tablets. There are three different brands of antacids available in the lab (Tums, Alka-Seltzer, Rolaids, etc.).
Materials
Each lab group will need the following materials:
- 1 antacid tablet (random brand)
- 100 ml of distilled water’
- 2-250 ml beakers
- 5 drops of bromocresol purple
- 0.1 N HCl OR 0.1 N NaOH
- 50 ml buret
- ring stand and clamp
- pH probe
Method
- Retrieve an antacid tablet from the instructor.
- Crush the antacid in 100 ml of distilled water in a beaker.
- Transfer 50 ml of the solution to clean 250 ml beaker.
- Share remaining 50 ml antacid solution with another group who has a different brand of antacid.
- Your group should end up with two beakers, each containing a different antacid. Label the beakers.
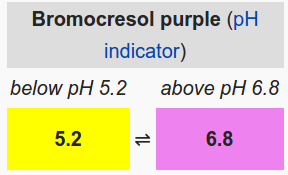
- Add 5 drops of bromocresol purple (0.04% solution) to each antacid sample.
- Measure the pH of each of the antacid solutions and observe the color.
- Choose one of the antacids to test first. Determine if you want to titrate with an acid or with a base.
- Fill the buret with the acid or base.
- Open the tap of the buret to add 2 ml of the acid or base to the antacid beaker and swirl briefly to mix.
- Use the probe to record the pH and observe the color of the solution. Record both pieces of data.
- Continue to add the acid or base in increments of 2 ml (with swirling) and record the pH and color of the antacid solution. Stop when the solution turns yellow.
- Repeat this process with the other brand of antacid.
Scatterplot
You will use the data you collected to create a scatterplot as part of the Lab 3 assignment. You will plot the pH readings on the y-axis and the volume of acid or base added on the x-axis. If you do not have access to Excel, you can make your scatterplot in Plot.y or Google Sheets.
Reflection Questions
- What is a buffer?
- What is the biological significance of a buffer?
- Explain differences between strong and weak acids and bases.
- What are the differences between acids and a bases in terms of [H+] and [OH–].
- Why is pH 7 designated as neutral?
- How does the antacid work?
- How much difference in [H+] is there between pH 4 and pH 8?