Table of Contents
Absorbance Spectra of Photosynthetic Pigments
Overview
In this activity, you will identify the colors that are seen at different wavelengths. Using data about the percentage of light absorbed by samples from three different plants, you make a determination about the colors of the pigments in those samples.
This activity may be assigned by your instructor as a pre-lab activity.
Method
Use the visible spectrum below to fill in the colors on the table.

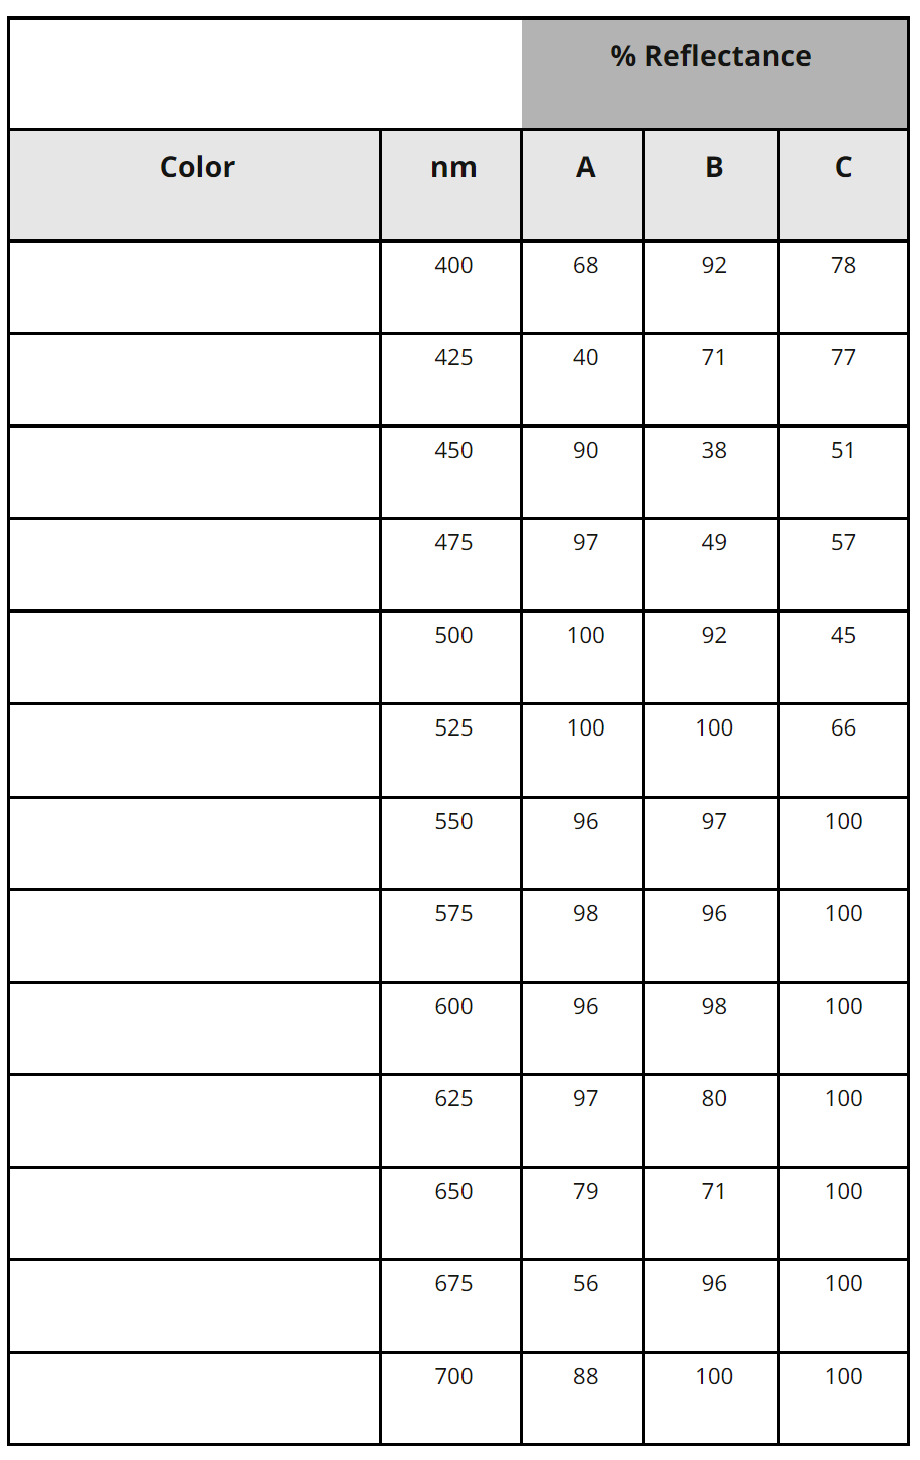
Use plot.ly to create a line graph showing the %Reflectance of the three samples (A, B, and C). %Reflectance should be on the y-axis and wavelength should be on the x-axis. Using your graph, what are the colors of the pigments found in each of the samples?
Print this page