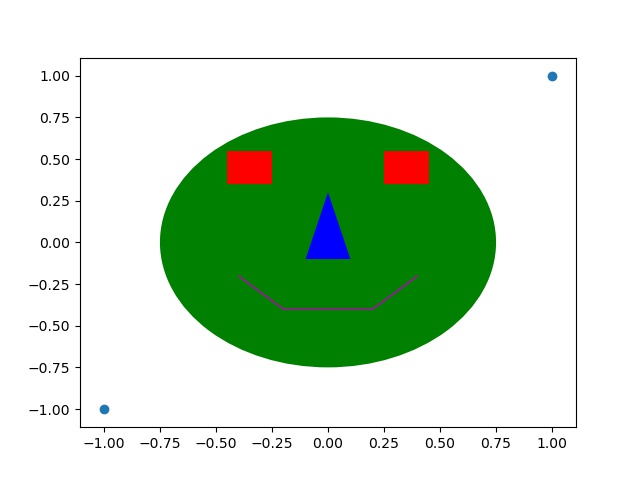
Another thing you can do is add shapes (called patches in matplotlib) to your plot. First one creates the shape; size, color, where it goes, etc. and then you add it to an axis. Note patches must be added to an axis, if you didn’t create one explicitly, but instead by default, you can grab it with plt.gca() which returns the current axis. Here’s an example:
f,ax=plt.subplots()

ax.scatter([-1,1],[-1,1])

circle = plt.Circle((0, 0), radius=0.75, fc='g')

ax.add_patch(circle)

rectangle1 = plt.Rectangle((0.25, 0.35), 0.2, 0.2, fc='r')

rectangle2 = plt.Rectangle((-0.45, 0.35), 0.2, 0.2, fc='r')

ax.add_patch(rectangle1)

ax.add_patch(rectangle2)

points = [[-0.1, -0.1], [0.0, 0.3], [0.1, -0.1]]

triangle = plt.Polygon(points,fc='b')

ax.add_patch(triangle)

points = [[-0.4, -0.2], [-0.2, -0.4], [0.2, -0.4], [0.4, -0.2]]

line = plt.Polygon(points, closed=None, fill=None, edgecolor='m')

ax.add_patch(line)
which makes the following image