Visualization is an important tool for both presenting the result of your numerical calculation and for checking what your code is actually doing. One of the most commonly used and powerful packages in python is matplotlib. One often just imports the pyplot methods as
import matplotlib.pyplot as plt
Then it is very simple to make some basic plots. An array of values can be generated with the numpy methods linspace or arange.
x=np.linspace(0.0,5.0,num=50)

x2=np.arange(0.0,5.0,0.1) #step by 0.1

y=x**2 #etc.
If one has two arrays x and y then one can do
plt.plot(x,y,linestyle='--',color='r')

plt.scatter(x,y,marker='o',color='b',label='points')
However, these easy methods somewhat obscure how plotting in matplotlib really works, which one needs to understand to make more complicated plots. Matplotlib plots are based on two objects, the figure and the axis. The figure is the entire plotting region, while an axis can be only part of that region and has the scale information for a plot. You can add as many axes as you want to a figure. To generate a figure and axis and then plot on that axis one can do:
f=plt.figure()

ax=f.add_subplot(1,2,1)

ax.plot(x,y)
Note that while you now have a figure, this in general won’t show it. You need to explicitly call plt.show() to show the figure or plt.savefig(‘fig.pdf’) to save the figure as a file. The extension you give for the save will determine the type of file is saves to. Also, using notebooks or IDEs will effect where the figure is displayed.
When one calls plt.plot() without first creating a figure and axis the code just generates them by default. But if one wants more control over the plot there are many options to how the figure and axis are generated. From here on methods will be given for the axis though most will work at the plt level, though sometimes the syntax is slightly different. Axes can either be created by trying to fit a certain number of plots onto the figure, or by specifying exactly where you want them.
f,axes=plt.subplots(Nrows,Ncols,figsize=(Lx,Ly))
or
f=plt.figure(figsize=(Lx,Ly))

ax1=f.add_suplot(Nrows, Ncols, index)

ax2=f.add_axes([xmin,ymin,width,height]) #figure units: 0 to 1

ax3=ax1.twinx() #new axis shares x but new y
Plotting points and lines
ax.plot(x,y,linestyle=':')

ax.scatter(x,y, marker='+')

ax.errorbars(x,y,xerr=xerr,yerr=yerr)
1D histograms
ax.hist(array)
2D plots can be made if you have a z value for each x and y value. This can just be a 2D array of z values. One can make a density plot from x and y values, by determining the number of points in a bin. For example we can start with a random set of x and y values.
N=100000

x=np.random.normal(size=N)

y=np.random.normal(size=N)

ax.hist2d(x,y) #makes a plot

ax.hexbin(x,y) #uses hexagon instead of square bins

hist,xed,yed=np.histogram2d(x,y,bins=25) #returns array

ax.imshow(hist,cmap='brg',extent=[xed[0],xed[-1],yed[0],yed[-1]])

cs=ax.contour(hist,[1,5,8],extent=[xed[0],xed[-1],yed[0],yed[-1]]))

ax.clabel(cs,inline=1,fontsize=10,fmt='%d')
Customizing plots You will often want to customize your plot, not use the default setting. Everything can be customized, the range of the plot, the labels, the fonts, the size of fonts, the ticks, gridlines, etc. Also, important extras can be added like legends and color bars.
ax.set_xlim(xmin,xmax)

ax.set_xlabel(xlabel)

ax.legend()

plt.colorbar()
Patches
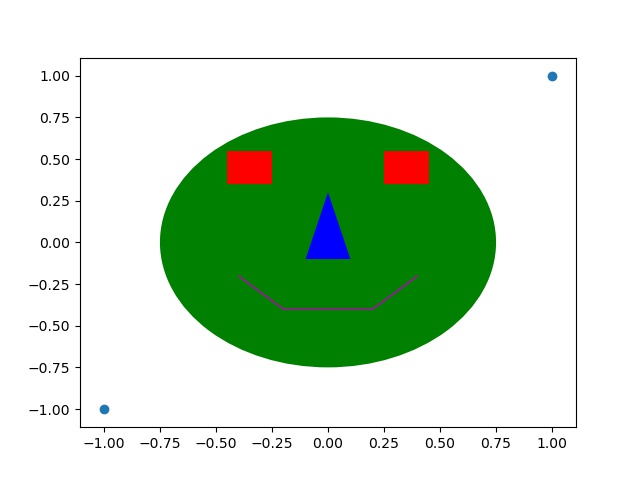
Another thing you can do is add shapes (called patches in matplotlib) to your plot. First one creates the shape; size, color, where it goes, etc. and then you add it to an axis. Note patches must be added to an axis, if you didn’t create one explicitly, but instead by default, you can grab it with plt.gca() which returns the current axis. Here’s an example:
f,ax=plt.subplots()

ax.scatter([-1,1],[-1,1])

circle = plt.Circle((0, 0), radius=0.75, fc='g')

ax.add_patch(circle)

rectangle1 = plt.Rectangle((0.25, 0.35), 0.2, 0.2, fc='r')

rectangle2 = plt.Rectangle((-0.45, 0.35), 0.2, 0.2, fc='r')

ax.add_patch(rectangle1)

ax.add_patch(rectangle2)

points = [[-0.1, -0.1], [0.0, 0.3], [0.1, -0.1]]

triangle = plt.Polygon(points,fc='b')

ax.add_patch(triangle)

points = [[-0.4, -0.2], [-0.2, -0.4], [0.2, -0.4], [0.4, -0.2]]

line = plt.Polygon(points, closed=None, fill=None, edgecolor='m')

ax.add_patch(line)
which makes the following image
Animation
Finally it can be really useful to be able to animate our figures. To save animations you will need other free software that has tools for making movies. Two good choices are ffmpeg and ImageMagick. We can install ffmpeg with conda so first
conda install ffmpeg
Then the animation process is basically you need a function that takes the frame number as input and advances to the next image you want. Then you pass your figure and this function into
anim = animation.FuncAnimation(fig, func, N)
where N is the number of frames you want in your animation. Here is an example:
import matplotlib.pyplot as plt

import matplotlib.animation as animation

import numpy as np
fig = plt.figure(figsize=(5,5))

ax = plt.axes(xlim=(-1.25, 1.25), ylim=(-1.25, 1.25))

sun=plt.Circle((0,0),radius=0.3,facecolor='yellow')

ax.add_patch(sun)

earth = plt.Circle((0, -1), 0.15, fc='b')
def init():

earth.center = (0, -1)

ax.add_patch(earth)

return earth,
def animate(i):

x = np.cos(np.radians(i))

y = np.sin(np.radians(i))

earth.center = (x, y)

return earth,
anim = animation.FuncAnimation(fig, animate,

init_func=init,frames=360,interval=20,blit=True)

anim.save('solar_system.mp4'). #requires ffmpeg

#alternatively save as a gif

writergif = animation.PillowWriter(fps=30)

ani.save('filename.gif',writer=writergif)
This makes this animation:
Using matplotlibs animation methods may or may not make things easier depending on what you want to do. You can always instead just make a bunch of images and then use ffmpeg to stitch them into a video. If you’ve made images called img01.png to img50.png and you want to make them into a video, then on the command line just do
ffmpeg -framerate 30 -i img%02d.png movie.mp4
There are many important controls on how your movie is encoded, frame rates, etc. look for help on ffmpeg.
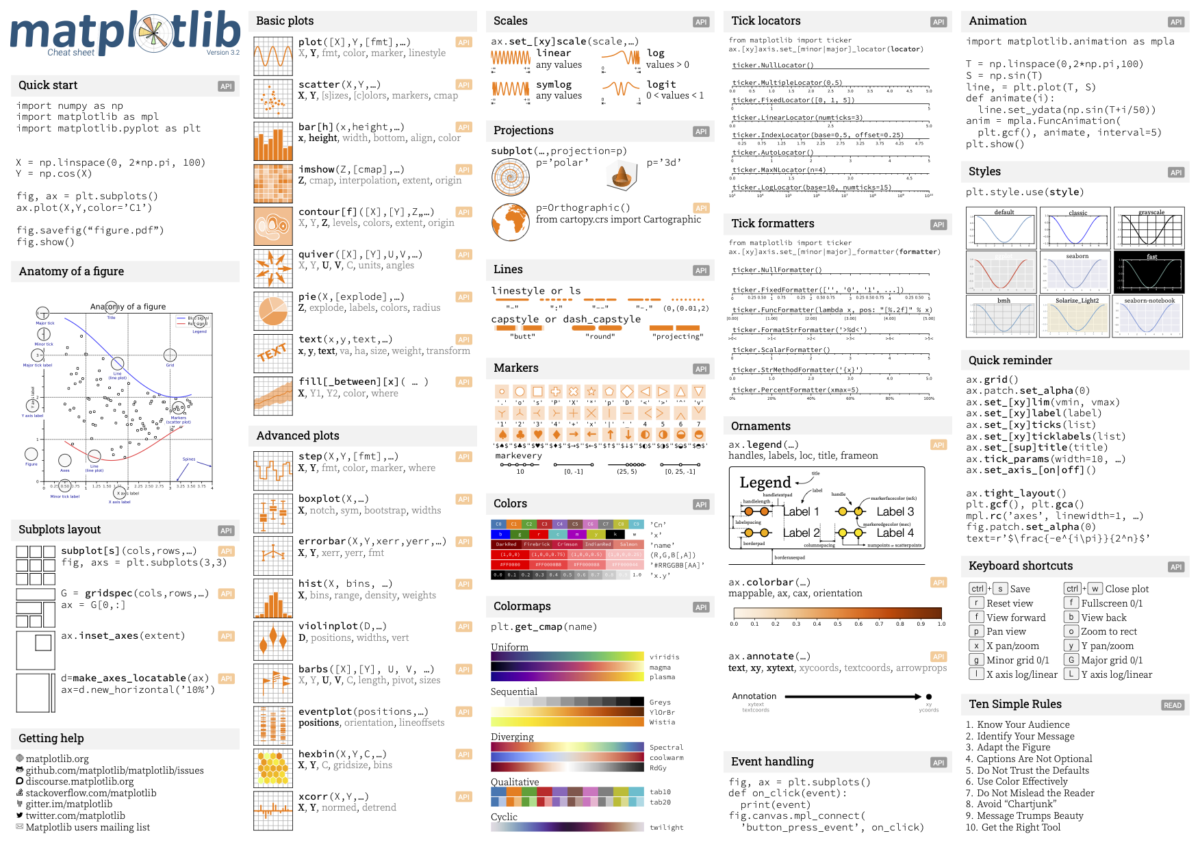
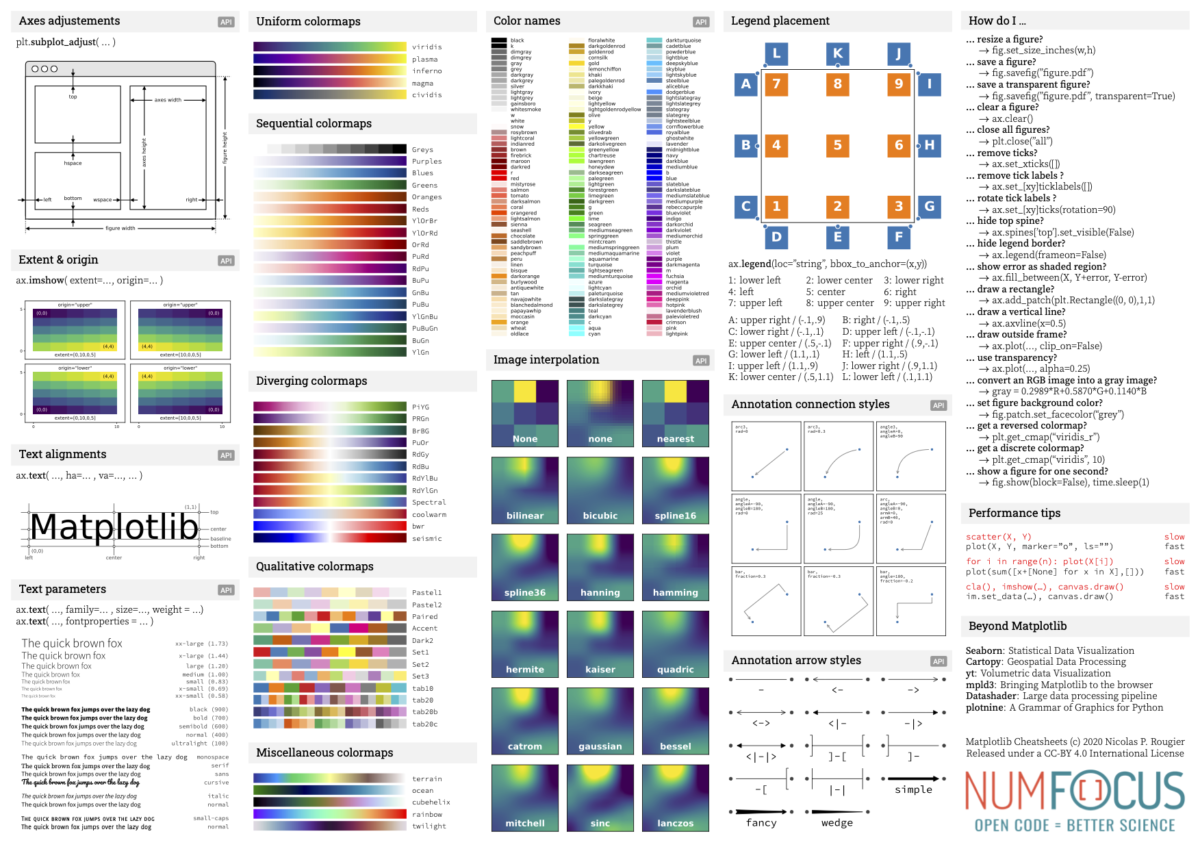
Here are some cheatsheets to help with some of the commands: