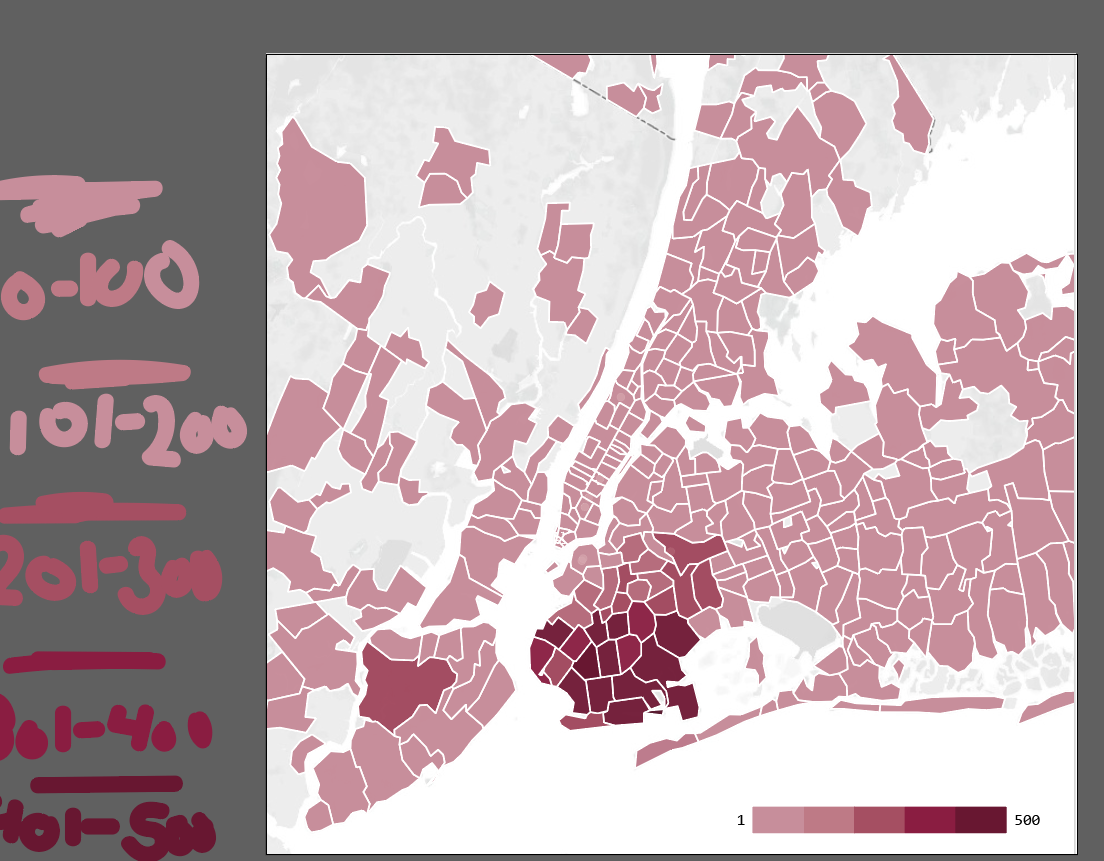
After numerous rounds of verifying our Excel sheet document, we finally received the green light today to update the school’s heatmap data. A heatmap is a fantastic tool for visualizing information, offering an intuitive way to understand complex data. I like to think of it as a sort of heat sensor, where colors range from blue (cool and distant) to red (hot and close). In the context of our data, it’s more about shades of a single color: the lightest shade indicates the fewest applicants to Brooklyn College, while the darkest hue represents the most.
Taking the lead on this project was both exciting and challenging. Initially, I struggled to interpret the information on the map correctly. To get on the right track, I turned to John for some much-needed clarification. He pointed out the rubric at the bottom of the heatmap, which made everything click for me.
With countless zoom-ins on the map and a checklist on my phone to ensure I didn’t get stuck on one ZIP code for too long, I meticulously worked through the data. To keep myself organized, I added a color rubric on the side as a reference, ensuring I used the correct shades consistently.
After a lot of dedication and precision, I successfully completed the task. The updated heatmap now clearly displays the application trends for Brooklyn College, making it a valuable resource for our team. This project was a great learning experience in attention to detail and the power of visual data representation.