- Expensive, $2.75 for a single ride
- Rise in cost but no improvement in the quality of transportation services
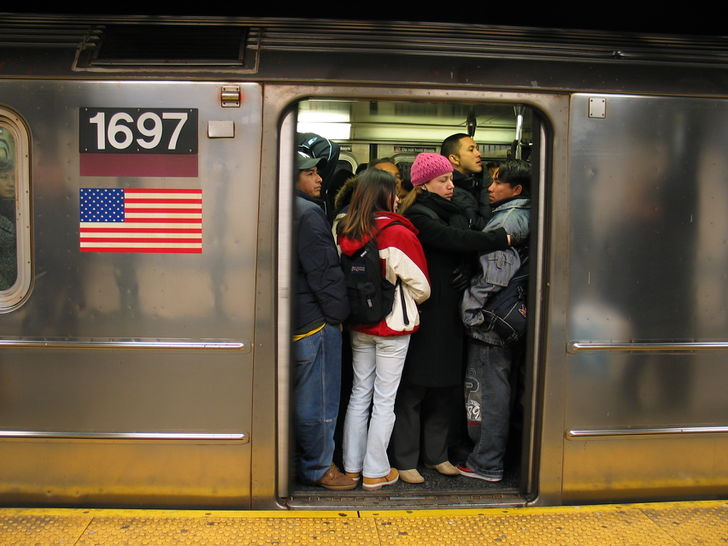
- Unsanitary and crowded
- Poor air quality
- Delays and always under construction
- Cheapest way to travel in New York
- Only stops at certain stations/destinations

Crowded Subway Cart
Subway Ridership at a Glance
Year Average Weekday Average Saturday Average Sunday Average Weekend Annual Total 2011 5,284,295
3,082,463
2,414,587
5,497,050
1,640,434,672
2012 5,380,184
3,172,627
2,490,736
5,663,363
1,654,582,265
2013 5,465,034
3,243,495
2,563,022
5,806,517
1,707,555,714
2014 5,597,551
3,323,110
2,662,795
5,985,905
1,751,287,621
2015 5,650,610
3,309,731
2,663,418
5,943,149
1,762,565,419
2016 5,655,755
3,202,388
2,555,814
5,758,201
1,756,814,800
MTA New York City Transit Bus Ridership at a Glance
Year Average Weekday Average Saturday Average Sunday Average Weekend Annual Total 2011
2,151,877
1,306,386
999,837
2,306,223
670,698,694
2012
2,169,311
1,309,666
998,863
2,308,529
667,910,621
2013
2,166,376
1,314,515
1,007,340
2,321,854
677,569,432
2014
2,123,092
1,305,437
1,024,279
2,329,716
667,051,170
2015
2,070,386
1,278,031
995,788
2,273,819
650,681,784
2016
2,038,119
1,221,299
957,427
2,178,725
638,413,113
http://web.mta.info/nyct/facts/ridership/
The OpenLab at City Tech:A place to learn, work, and share
The OpenLab is an open-source, digital platform designed to support teaching and learning at City Tech (New York City College of Technology), and to promote student and faculty engagement in the intellectual and social life of the college community.


top