“The study, published in the PLOS One journal in December 2017, examined which mental health conditions were driving displaced persons to New York City hospitals and emergency rooms most often. The top five were alcohol and substance abuse, schizophrenia and other psychotic disorders, mood disorders, and anxiety. They found that before the displaced group was priced out of their homes, they had similar rates of mental health illness to those who remained in their home: in terms of mental health illness, 24 percent and 22 percent; and equivalent levels of hospitalization (0.8 and 0.8 times per year) and emergency room visits (2.3 and 2.3 times per year) (Robiou 5).”
| Neighborhood | Percent Change in Average Rent, 1990 to 2010-2014 | Average Household Income in 1990 ($2015) |
| Williamsburg/Greenpoint | 78.7% | $53,550 |
| Central Harlem | 53.2% | $39,650 |
| Lower East Side/Chinatown | 50.3% | $54,350 |
| Bushwick | 44.0% | $42,500 |
| East Harlem | 40.3% | $47,300 |
| Morningside Heights/Hamilton Heights | 36.7% | $61,500 |
| Bedford Stuyvesant | 36.1% | $46,150 |
| North Crown Heights/Prospect Heights | 29.9% | $56,600 |
| Washington Heights/Inwood | 29.3% | $55,650 |
| Mott Haven/Hunts Point | 28.0% | $32,250 |
| Astoria | 27.6% | $64,600 |
| Sunset Park | 23.9% | $62,550 |
| Morrisania/Belmont | 23.5% | $36,900 |
| Brownsville/Ocean Hill | 20.5% | $43,100 |
| South Crown Heights | 18.1% | $62,900 |
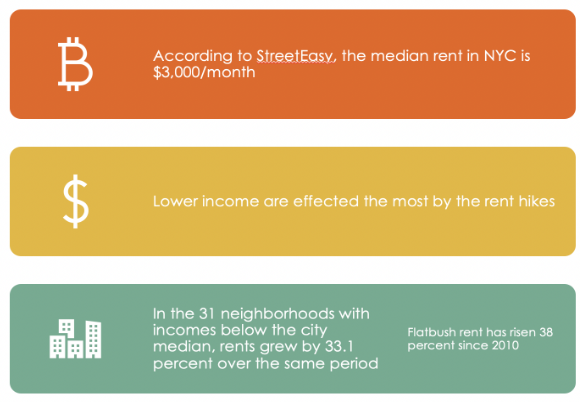
“Along with gentrification, the city has also seen skyrocketing rents and escalating rent burdens, which have fallen most heavily on the poor and disadvantaged. New York’s overall rent burden (which the report measures as the share of households spending 30 percent or more of their pre-tax income on rent) rose from 40.7 percent in 2000 to 51.7 percent in 2010-2014. Although all neighborhoods saw their rent burdens rise, gentrifying areas once again experienced the sharpest increase (from 42.3 percent in 2000 to 52.9 percent in 2010-2014). And yet, by 2010-2014, there was a greater share of rent-burdened households in non-gentrifying neighborhoods (58.5 percent), while higher-income neighborhoods saw slightly smaller shares than the rest (49.3 percent). Naturally, New York’s low-income households in gentrifying neighborhoods were the most rent-burdened of all, with an increase of 21 percentage points from 2000 to 2010-2014. But, surprisingly, moderate-income households in these neighborhoods saw a comparable increase of 18 percentage points during this same time period” (Florida 6).

