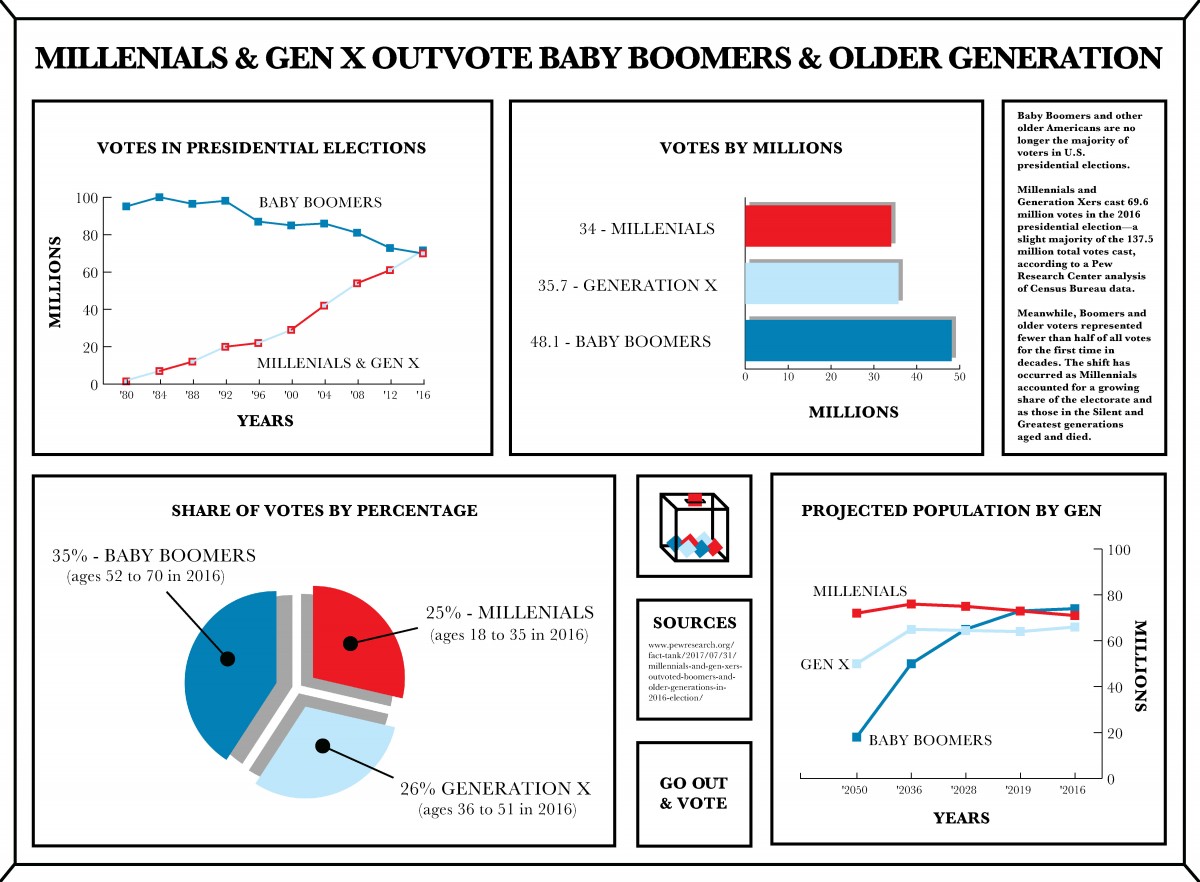
I decided to make an infographic on the voting records from the 2016 elections. In the infographic, I am displaying how these numbers have changed over time. I did this infographic to show people that Millenials and Gen X do go out and vote. I thought it was a good topic since the presidential elections are coming soon. (Tuesday, November 3rd)
About
Write a brief paragraph about this Course site and explain what visitors will find here.
Sharing
Logged-in faculty members can clone this course. Learn More!
Site Content
Categories
Blog Archives
Recent Comments
Find Library Materials
Library Information
Ursula C. Schwerin Library
New York City College of Technology, C.U.N.Y
300 Jay Street, Library Building - 4th Floor


Leave a Reply