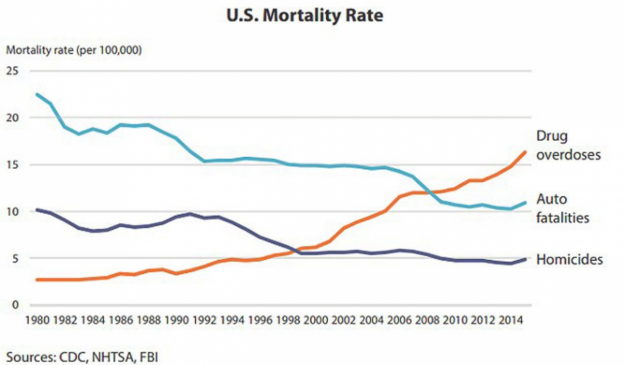
As per the graph above, it shows that in 2014, deaths from drug overdoses killed more Americans that automobile accidents/fatalities or Homicides. On average auto fatalities and homicides were recorded to be at a higher rate than drug over-dosage that was seen to instead be increasing. In between years 2006 and 2008 the deaths from drug overdoses recorded to be equal to auto fatalities. For the same period, a sharp growth in the deaths from Drug overdoses is seen in relation to the years before.
Additionally, in between the years 1998 and 2000, the deaths of the drug overdoses are equal to those from Homicides. In this same period, deaths from Homicides are at a decreasing rate.
According to the Daily Mail online article, the independent research group Police Executive Research Forum (PERF), lays bare the scale of the epidemic by analyzing the latest CDC figures.
The article goes on to say that, the usage of opioids have been seen to have killed more Americans than the 19-year Vietnam war, AIDS, crisis, cars accidents, suicides and homicides as shown in the graph above. It specifies the most devastating events in US that caused rapid death tolls for the last 50 years and show why addiction is such a deadly issue being faced in the US. The Vietnam war claimed 58,200 lives in 19 years and six months, opioids killed 64,070 Americans in 2016 alone. Experts notify that 2016 peak was just the beginning of medication addictions. It was noted that for the first time the leading cause of death for Americans below 50years is drug overdose, with an increasing blame going towards pharmaceutical companies.
Dailymail.com, Mia De Graaf, “Opioids killed more Americans in 2016 than in the entire 19-Year Vietnam War, staggering new report shows – as experts warn we haven’t seen the worst of it.” Daily Mail Online, Associated Newspapers, 17 Oct. 2017, http://www.dailymail.co.uk/health/article-4990604/Opioids-killed-Americans-2016-Vietnam-War.html
-
This topic was modified 7 years, 4 months ago by
 C.K.
C.K.
-
This topic was modified 7 years, 4 months ago by C.K.


