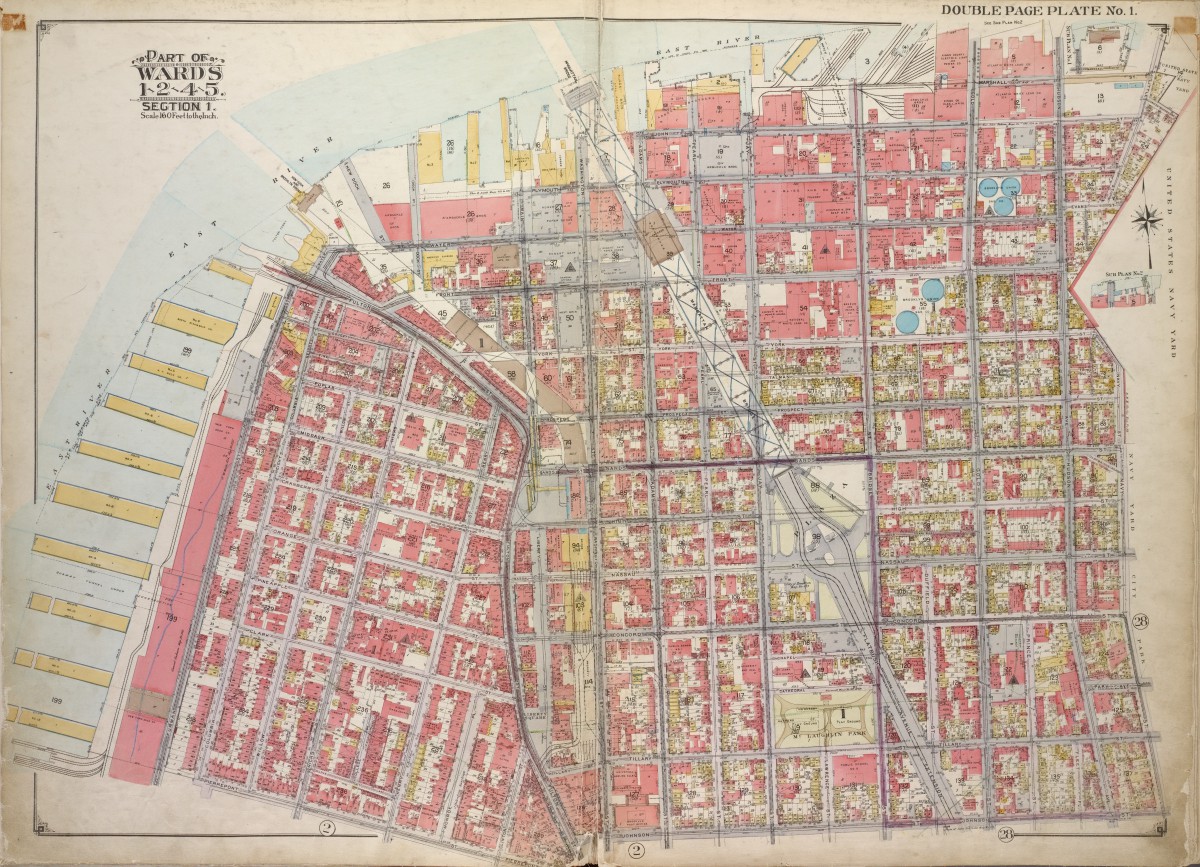
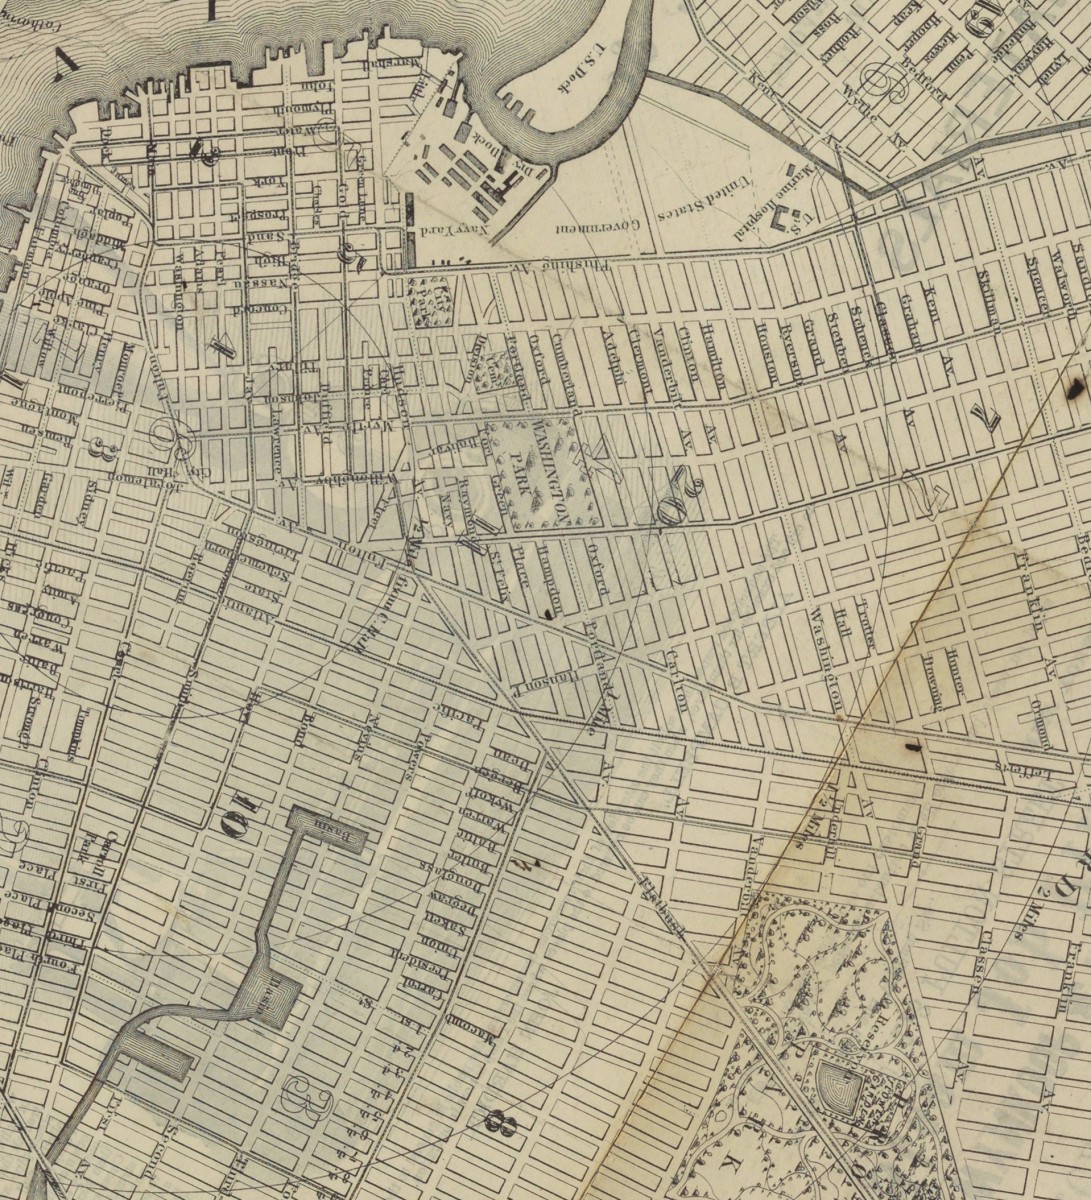
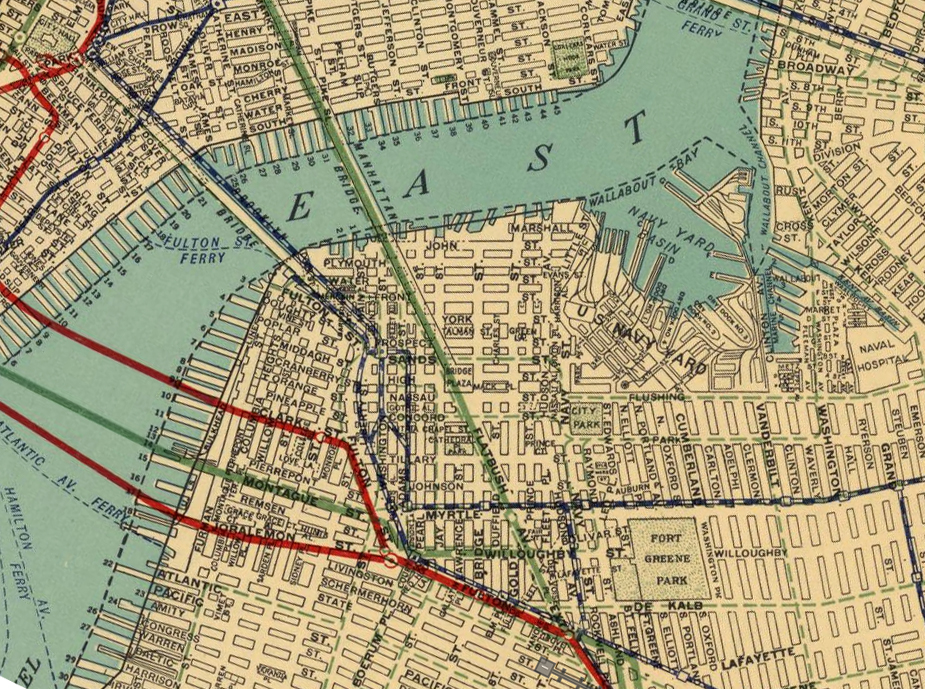
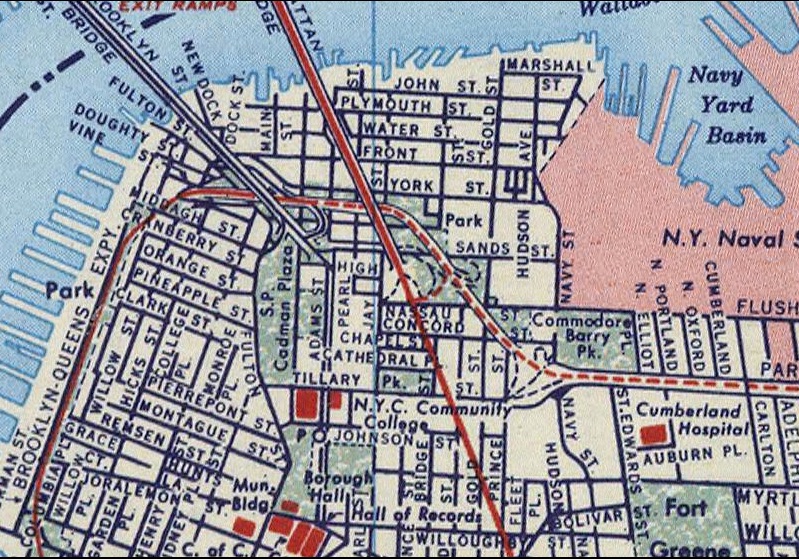
Maps provide a powerful view of cities, a view that lets us see cities as a system. This view emphasizes pattern. Repetition and variation become apparent. From this view we can “read” connection, connectivity. Anomalies jump out. Green occupies an exalted position. Hierarchy is reinforced or undermined. History may be readable, layers discernible. All of these things, and their inverses, can be deeply analyzed and studied through this medium of abstraction.
Not all maps are created equal. Not all maps seek to document the same information. The same city can have a different “look” based on the different lens each map offers. The maps here illustrate the differing lens and their impact on the viewer’s reading of the city they describe. These maps describe the same place, downtown Brooklyn, but at different moments of its evolution and history.


Leave a Reply