
*Please be advised all amounts are in Bangladeshi Taka, instead of US Dollar. 1 USD = 85 BDT
Tiffin Wallah
Executive Summary
There is a need in Dhaka, Bangladesh for a selection of quality foods service similar to Mealpal, and Tiffin Wallah will sell this top-quality food at a competitive price. The owner and sales manager have over 20 years of combined experience in business development and food service sales. We will continue to develop our excellent working relationship with smaller farmers and produce whole seller to bring the savings to the customer.
We will be successful because we offer something different: a timely pleasant experience with unmatched quality and hygiene practices. We will create a service environment that caters to the customer’s needs on a budget. We are selling highly modifiable products and brand experience to working-class young-men at price point that is only limited to certain caste group and limited to financially affluent neighborhoods in a country of 200 million people. We estimate an optimistic gross margin over the industry average. We will be successful because of the excellent team we have assembled and the drive and determination of the owners.
1.1 Objectives
- 100% customer satisfaction, measured through repeat customers, referrals and surveys.
- To achieve and surpass the industry average profit margin within the first two-years.
- To achieve a respectable net profit by year two.
- To create a conglomerate that helps young entrepreneurs start their own venture
- To create a foundations that helps and educate small farmers to create better organic produce and stay in business through sustainable practices
1.2 Mission
“To exceed the customer expectation at every facet of the business relationship”
Tiffin Wallah provides a unique lunch buying experience to the customers in the Dhaka region. One that focuses on customer’s needs, wants, and satisfaction in a market where vendor is always right. We understand that lunch purchasing is a necessary due to the distance between residential and commercial space, options are limited and experiences are poor. Our goal is to provide the customer with an enjoyable, exceptional service by satisfying individual customer’s practical lunch needs.
We also believe it is important to have quality food at a low cost, and stellar service that should be limited the wealthy. Our company will make a profit by generating sales. It will provide job satisfaction and fair compensation to its employees, and a fair return to its owners. Hard work and performance is rewarded through bonuses and commissions. Job satisfaction is very important for employees and owners, we will create a work environment that is enjoyable and profitable for all.
1.3 Keys to Success
To succeed in this business we must:
- Put together a team of experienced professionals.
- Secure an excellent communication and customer service outlet.
- Establish a network of suppliers, in order to buy and produce products that are of the highest reliability and quality, at a competitive price. • Ensure customer satisfaction by encouraging the two most important values, taste, and Tiffin Wallah .
- Create high morale by rewarding employee success with monetary compensation.
*Please be advised all amounts are in Bangladeshi Taka, instead of US Dollar. 1 USD = 85 BDT
Company Summary
Tiffin Wallah is an independently owned business, established in 2021 by an stretegy and customer service expert with over 15 years of customer involvement experience. We provide a unique lunch buying experience for customers in Dhaka-Metro Area by providing inspected, top quality, fresh food for working-class millennial and generation-x consumers, at a competitive price. We are conveniently mobile to serve anywhere with 5 miles driving distance.
2.1 Company Ownership
Tiffin Wallah is a privately held corporation. It will be registered as a Subchapter S, with ownership 60%-Rafi Sarkar, 40%-Investor.
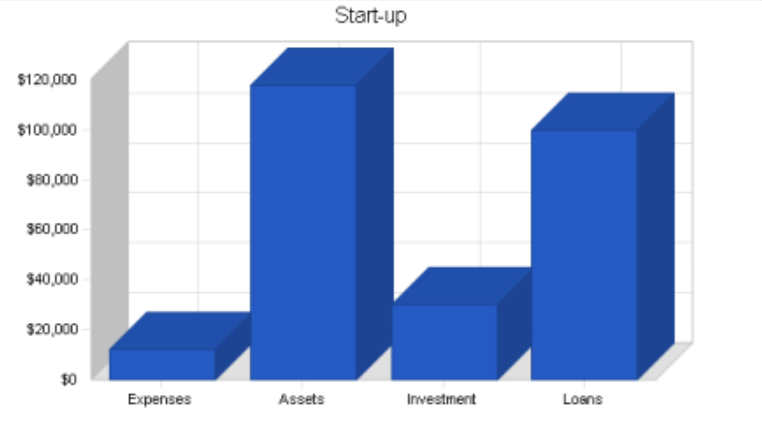
2.2 Start-up Summary
Almost 90% of start-up costs will go to asset creation. Start-up costs will be financed through a combination of owner’s investment, short-term Meal plans (VA business Meal-plan), and long-term borrowing. The start-up chart shows the distribution of financing.
Other miscellaneous expenses include:
- Legal fees for business establishment (ownership, and no sell agreement).
- Stationary, office supplies.
- Marketing/advertising fees.
- Initial consultation to establish records with an accountant.
- Rent for lot and office.
- Establish a Web page for advertising.
- Expensed equipment (two computers, two desk, Fax/copier, phone lines, and office furniture).
- One month initial start-up investment in foods.
START-UP REQUIREMENTS
Start-up Expenses
Legal $500 Stationery etc. $200 Advertising $1,000 Consultants (Accountant) $500 Rent $4,000 Expensed Equipment $4,500 Internet Web page $1,000 Other $500 TOTAL START-UP EXPENSES $12,200 Start-up Assets
Cash Required $67,800 Start-up Inventory $50,000 Other Current Assets $0 Long-term Assets $0 TOTAL ASSETS $117,800
*Please be advised all amounts are in Bangladeshi Taka, instead of US Dollar. 1 USD = 85 BDT Total Requirements $130,000
START-UP FUNDING
Start-up Expenses to Fund $12,200 Start-up Assets to Fund $117,800 TOTAL FUNDING REQUIRED $130,000 Assets
Non-cash Assets from Start-up $50,000 Cash Requirements from Start-up $67,800 Additional Cash Raised $0 Cash Balance on Starting Date $67,800 TOTAL ASSETS $117,800 Liabilities and Capital
Liabilities
Current Borrowing $100,000 Long-term Liabilities $0 Accounts Payable (Outstanding Bills) $0 Other Current Liabilities (interest-free) $0 TOTAL LIABILITIES $100,000 Capital
Planned Investment
Owner #1 $20,000 Owner #2 $10,000 Additional Investment Requirement $0 TOTAL PLANNED INVESTMENT $30,000 Loss at Start-up (Start-up Expenses) ($12,200) TOTAL CAPITAL $17,800 TOTAL CAPITAL AND LIABILITIES $117,800 Total Funding $130,000
*Please be advised all amounts are in Bangladeshi Taka, instead of US Dollar. 1 USD = 85 BDT
2.3 Company Locations and Facilities
- The company office is located at Mirpur, Sector 1, Dhaka, Bangladesh.
- The office and Kitchen is approximately 1,000 square feet and has ample space for the first three years of growth. • The 20,000 square foot lot and building is leased from the principal owner for supplies and storage.
Products
Tiffin Wallah sells food and stellar service at a competitive price. Tiffin Wallah buys produce that are not retail sale quality from well known wholesalers, and small local farmers. Tiffin Wallah continually maintains a diverse stock of produce, providing the widest selection for individual needs.
Produce are purchased daily, to add to the current stock on hand. Each produce category is thoroughly inspected by chef with over 25 years of experience. Only produce that pass this critical inspection and taste test are kept on site for use.
3.1 Product Description
Tiffin Wallah sells all types of food from traditional South-Asian cuisine to western-fast food. We cater to each customer individually, to satisfy his own practical needs and wants. We buy only the best produce at or below wholesale in order to bring the savings to the customers. We also offer custom menu creation service to customers. If we do not have the food they want in stock, we will modify our existing menu or find one for them.
3.2 Competitive Comparison
Tiffin Wallah has several advantages over its leading competitor:
- Quality inventory, backed by an excellent customer service, for a competitive price.
- A very thorough inspection process and hygiene practices to avoid selling any cross contaminated food.
- A highly experienced sales staff with a mission to serve the customers by making the necessary purchase of a lunch an enjoyable experience with unmatched customer satisfaction.
*Please be advised all amounts are in Bangladeshi Taka, instead of US Dollar. 1 USD = 85 BDT
3.3 Sourcing
Sourcing is critical for any enterprise, and has a direct impact on food pricing. Our primary source for produce is the local farmers (Salar, Tongi) who wholesale produce to reduce a large unsold food inventory. We will thoroughly inspect each produce and select only the best at our price margin to maintain a high quality of inventory. We will also provide a consignment service, by exception, for quality produce that are in demand, for a 15% handling fee. Lastly, we will take limited trades of unsold goods from retail shops; ensuring end value is at or above wholesale price. The majority of our lunch will be priced between $1,000 and $10,000, averaging $5,000 per category. A far greater profit margin is available for low-end $2,000 lunch menu than high-end $10,000 lunch menu. Most sales promotions and advertising costs are limited, and will be handled in-house by our record keeper.
3.4 Sales Literature
Tiffin Wallah will use local advertising in daily newspaper classified, Food Ads, and the blogs to reach our customers.
- Newspaper advertisements in Dhaka Tribune regional newspapers that advertise specific sales promotions.
- Online lunch classified through a company Web page.
3.5 Future Products
Future products will include specialized sales in holiday menu, specialty food and sea/fish products. These products will be purchased and sold through the same methods. They will further diversify a wide selection and there exist limited competition in the food sector business.
Market Analysis Summary
Almost everyone needs food to sustain themselves. Many young men are so far from home that they cannot bring food and store it properly. Due to the recent success in economy, there is a large disposable income for lunch buying. New cuisine sales have enjoyed the largest single month gain in October 2019, up 24%.
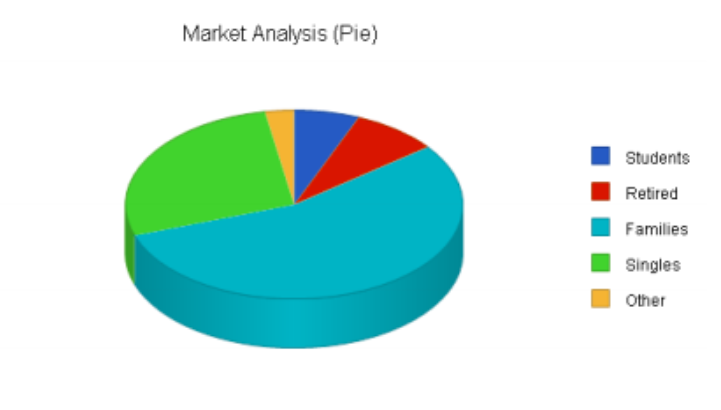
4.1 Market Segmentation
Our market segmentation will consist of four basic segments; Youngman, supervisors, husband, and singles.
Young-men (student) will include college age students who need a safe and economical food. This group is concerned with price, flashy looks, and being cool. These buyers tend to be less educated and will buy on impulse paying more for less food. They will also buy food more often than others, on average every two to three a day.
*Please be advised all amounts are in Bangladeshi Taka, instead of US Dollar. 1 USD = 85 BDT
The supervisor (retired/business owner) group will focus on practicality. Cost may be less important than quality and features. This group wants comfortable, nicely equipped dishes at a reasonable price. They will want a lunch that will satisfy their hunger.
Husband (family) will focus on safe, practical food. Something that will get him through the day, can relieve stress, and meet all his needs. Many will be on a budget, and price may be a big factor. They will shop around and educate themselves on lunch, shopping for a specific menu or food.
The last group is the Cool Guy (singles). They are similar to the Youngman in that they want flashy cool trend, but may be a working professional who can afford to pay more for a higher-quality food.
The Market Analysis pie chart shows an average increase of 10% in potential customers. Many of these groups will want to trade up for a newer or more expensive food at a later date. This will create an ever-increasing market for used car buyers.
MARKET ANALYSIS YEAR 1 YEAR 2 YEAR 3 YEAR 4 YEAR 5
Potential Customers Growth CAGR
Students 10% 45,000 49,500 54,450 59,895 65,885 10.00%
Retired 12% 60,000 67,200 75,264 84,296 94,412 12.00%
Families 10% 400,000 440,000 484,000 532,400 585,640 10.00%
Singles 10% 200,000 220,000 242,000 266,200 292,820 10.00%
Other 10% 20,000 22,000 24,200 26,620 29,282 10.00%
Total 10.17% 725,000 798,700 879,914 969,411 1,068,039 10.17%
4.2 Target Market Segment Strategy
We focus on providing for the average lunch buyer first. Our focus will be on those most likely to purchase low-end, low-cost food (highest profit margin). The youngman, supervisor, husband, and cool guy have very different needs and wants. We will focus on each group separately, and prioritize our efforts. We will look at every customer as a potential repeat customer, reference, or spokesperson for other meal buyers.
4.2.1 Market Needs
There are two important underlying needs: quality service before food at competitive prices, and a large supply of available food menus.
1. There is a real need for a highly professional restaurateur who can provide quality food at competitive prices, through hygienic environment. 2. There is also a practical need for new food provider to move a large amount of food inventory that takes up valuable space on supplier’s lots. 4.2.2 Market Trends
We have four major trends that help us:
1. New food sales have boomed over the last five years. This has contributed to a large supply of quality lunches and a 14% growth in food sales. October 2019 had a record sales increase of 24%. Consumers recognize the value of a good readymade mood, and are willing to pay for it. Even those consumers who would be more prone to purchasing restaurant food are now purchasing meal plans.
2. Lower prices, and a higher income are creating an opportunity for buyers to purchase more food for the same price. Food service plans are currently as low as $60. Typically many have paid as much as $100-120. The consumer’s savings are in the thousands for a long-term buying.
3. Specific food, like burgers and Chinese are more popular and have sold better than curry based food.
4. Meal plans are becoming more popular for work due more hours spent working and traveling.
4.2.3 Market Growth
*Please be advised all amounts are in Bangladeshi Taka, instead of US Dollar. 1 USD = 85 BDT
According to available market information, meal plans have risen 14%. Spending on meal plans continues to rise, despite a slowing economy. As population increases in the area, so will the need for meal plans. Another strength is the fact that people are constantly seeking different style of food. The average person buys a new dish every four days: The result is continued increases in sales and profit margins.
4.3 Industry Analysis
• The meal plan industry is continuing to grow at or above population increases. Food is the second largest purchase most consumers make, and more people are buying ready made food than ever.
• Relatively good margins have resulted in some success in the local restaurant industry.
4.3.1 Competition and Buying Patterns
Food and restaurants are notorious for unethical sales & production practices. Customers are inherently cautious and untrusting as a result. The more we can provide a high-quality food experience, the more successful we will be. Our salesmen will provide a friendly and personal experience for the buyer. We will follow up and ensure customer satisfaction. We will rely on these customers for an excellent reference to other lunch buyers. This company will build an excellent working relationship with our suppliers and customers.
4.3.2 Industry Participants
Meal plan providers in the area are still relatively average in size. Restaurants have varying degrees of success based primarily on location, products, and the sales team assembled. Quality sales personnel are usually not adequately compensated for their services, and as a result they tend to move from one business to the next.
4.3.3 Main Competitors
Our closest, similar competitors are Aladin Sweets, Home-cooks, & local restaurants.
• The primary competitors will be those in and around Dhaka City. Home-cooks is a large, well-established taste buds, with approximately 75% of the local market share. Home-cooks has a large operation however without a well-trained service staff. Our sales manager is a former Home cooks sales manager, who understands the competition’s operations very well.
• Aladin-Sweets offers a limited selection, and appears to be unorganized. Aladin’s does not offer any competitive marketing or food inventory and primarily focuses on the $1-2,000 producs.
Strategy and Implementation Summary
Our location is a very important competitive edge. We are in Dhaka City because people travel from all over the area to work there.
*Please be advised all amounts are in Bangladeshi Taka, instead of US Dollar. 1 USD = 85 BDT
The other competitive edge we need to develop is the service experience and reputation as a local leader in customer satisfaction. This advantage is important to us because we rely on word of mouth to generate additional customers. Tiffin Wallah is our difference.
5.1 Marketing Strategy
Our marketing strategy will focus on two segments. Those segments are described in the following subtopics. We will implement a strategy that treats customers as a community. This means our marketing resources will be centered on advertising both sales promotions (events) and personal sales (customer service, friendly atmosphere).
• The marketing budget will not exceed $6,000 per year.
• Marketing promotions will be consistent with the Mission Statement and support the following objectives:
1. 100% customer satisfaction, measured through repeat customers, referrals and surveys.
2. To achieve a respectable profit margin within the first three-years.
3. To achieve a healthy net profit by year two.
5.1.1 Pricing Strategy
Our pricing strategy will be based on competitive restaurant prices plus vat fees. We will not exceed competitive retail prices, and will attempt to sell at wholesale plus a fair profit, generally 15-25%. Quality and price say a lot about our food. The lunches that are rare or not readily available to meet demand will be priced accordingly. The average industry mark-up for similar food is 20-30%.
5.2 Sales Strategy
Sales compensation is based on a percent of profits. We will invest adequate time and resources into training each member of the sales team and into good customer relations. Salesmen will be paid a portion of their salary based on commission. Good performance is rewarded with increased commission and bonuses. However integrity will not be sacrificed for sales. Customer satisfaction will continue to be a top priority. All potential sales will be attended to in a timely fashion and long-term salesperson-customer relationships will take precedence over sales closure.
5.2.1 Sales Forecast
The following table and charts give a run-down on forecasted sales. We expect sales to increase at a slow rate per month for each product in the first year. From June through September we expect minimal growth during our start-up period. October through December we expect decreased sales due to historical trends, and a depreciation in value based on less demand. February through August we expect increased sales growth again. In 2004 and 2005, we expect solid steady sales growth as Tiffin Wallah claims a larger market share. We expect increased sales in lower-priced foods, and this
*Please be advised all amounts are in Bangladeshi Taka, instead of US Dollar. 1 USD = 85 BDT
will be our primary product that yields the highest margin. We feel this sales forecast is realistic based on the market analysis of similar businesses performance. The opportunities for used car sales has increased with the high sales of new foods, increasing the number of quality late model used foods in the market. More new car buyers directly effect the number of used cars available. The current low interest rates also have a positive impact on the high-end food purchases. The population growth in the area creates a need for more foods as well.
The risks involved with this forecast include technology and the need for low impact environment friendly transportation. Older used cars tend to be less efficient, and will become less popular. Current hybrid foods are priced extremely high, and car makers have not found an economical answer for consumers. We estimate conservative earnings from selling extended warranties and from selling Meal-plans (we will sell the Meal-plan for the lender).
Note: For food purchases, the per-unit price of inventory purchases includes the cost of detailing foods.
SALES FORECAST
YEAR 1 YEAR 2 YEAR 3
Unit Sales
Low-end food 298 320 345
Average food 154 162 170
High-end food 79 85 90
Meal-plan sales 166 175 200
Holiday sales 136 140 150
Other 49 50 50
TOTAL UNIT SALES 882 932 1,005
Unit Prices Year 1 Year 2 Year 3
Low-end food $2,000.00 $2,200.00 $2,400.00
Average food $4,979.87 $5,100.00 $5,200.00
High-end food $9,958.23 $10,200.00 $10,500.00
Meal-plan sales $400.00 $400.00 $400.00
Holiday sales $200.00 $200.00 $200.00
Other $5,000.00 $5,100.00 $5,200.00
Sales
Low-end food $596,000 $704,000 $828,000
Average food $766,900 $826,200 $884,000
High-end food $786,700 $867,000 $945,000
Meal-plan sales $66,400 $70,000 $80,000
Holiday sales $27,200 $28,000 $30,000
Other $245,000 $255,000 $260,000
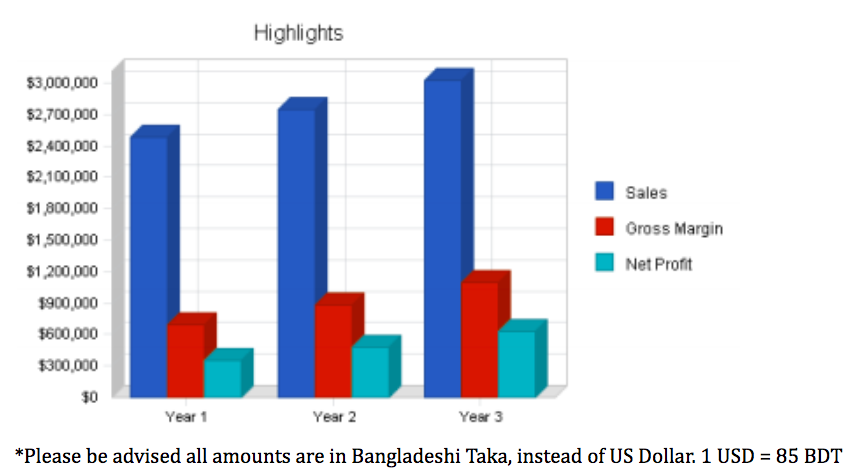
TOTAL SALES $2,488,200 $2,750,200 $3,027,000
Direct Unit Costs Year 1 Year 2 Year 3
Low-end food $1,200.00 $1,100.00 $1,000.00
Average food $3,500.00 $3,500.00 $3,500.00
High-end foods $8,000.00 $7,900.00 $7,800.00
Meal-plan sales $0.00 $0.00 $0.00
Holiday sales $0.00 $0.00 $0.00
Other $4,500.00 $4,500.00 $4,500.00
Direct Cost of Sales
Low-end foods $357,600 $352,000 $345,000
Average foods $539,000 $567,000 $595,000
High-end foods $632,000 $671,500 $702,000
Meal-plan sales $0 $0 $0
Holiday sales $0 $0 $0
Other $220,500 $225,000 $225,000
Subtotal Direct Cost of Sales $1,749,100 $1,815,500 $1,867,000
5.2.2 Sales Programs
Sales programs will include sales awards for the highest sales, bonuses, and customer service awards for those employees who best exemplify Tiffin Wallah ‘s commitment to customers.
We will provide quarterly training and educational opportunities by sending employees to professional development training for their respective area.
5.3 Strategic Alliances
We depend on our alliance with local farmers and wholesalers to maintain our inventory. This relationship is crucial to our success and will be placed ahead of petty differences. Our financial relations with these groups will be handled in a timely and accurate manner. We need to make sure that the personnel, and especially the ownership, of our allies are aware of our support and reciprocation. We will also depend on outside sources for professional development of our sales staff.
*Please be advised all amounts are in Bangladeshi Taka, instead of US Dollar. 1 USD = 85 BDT
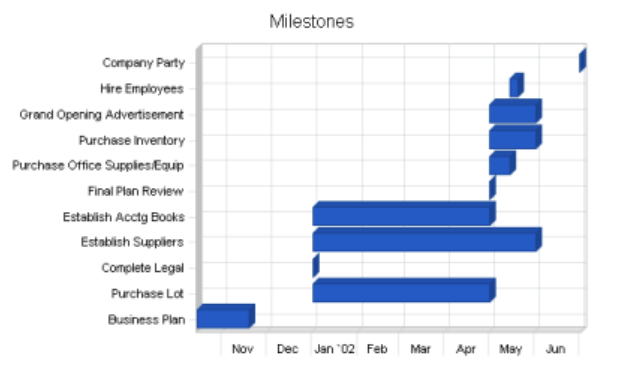
5.4 Milestones
The accompanying table lists important program milestones, with dates, managers in charge, and budgets for each. The milestone schedule indicates our emphasis on planning for implementation. The milestone table shows purchasing and marketing goals. What the table doesn’t show is the commitment behind it. Our business plan includes complete provisions for plan-vs.-actual analysis, and we will hold follow-up meetings every month to discuss the variance and course corrections, and a final plan review on 5/1/21.
MILESTONES
Milestone Start Date End Date Budget Manager Department
Business Plan 10/15/2020 11/19/2020 $0 Owner Marketing
Purchase Lot 1/1/2021 5/1/2021 $0 Owner Marketing
Complete Legal 1/1/2021 1/1/2021 $500 Owners Management
Establish Suppliers 1/1/2021 6/1/2021 $0 Sales Mgr Sales
Establish Acctg Books 1/1/2021 5/1/2021 $500 Owner, admin Records
Final Plan Review 5/1/2021 5/1/2021 $0 Owner ALL
Purchase Office 5/1/2021 5/15/2021 $4,700 Owner Administrative
Supplies/Equip
Purchase Inventory 5/1/2021 6/1/2021 $50,000 Sales MGR Sales
Grand Opening Advertisement
5/1/2021 6/1/2021 $500 Sales MGR Administrative
Hire Employees 5/15/2021 5/20/2021 $0 Owner Management
Company Party 7/1/2021 7/1/2021 $200 Owner Administrative
Totals $56,400
Web Plan Summary
Tiffin Wallah has a long-term plan of developing a Web page through Wix that customers can visit and view a list of current menus. We anticipate being operational within four months of opening. This would allow those customers who are seeking a specific food to save time by looking before they contact us. We will include photos and general information for each food.
We will rely on outside help to initially establish the page. We intend on maintaining the site ourselves through our record keeper and sales manager. Our Web page would be advertised through all correspondence, business cards, and advertisements. This will provide a “link” to additional information.
We will measure success through the hit counter and customer feedback, and re-evaluate or modify the Web page as necessary.
6.1 Website Marketing Strategy
Marketing for a retail business depends on recognition for expertise. It starts with our existing customer base, informing them of our Internet presence and encouraging their word-of-mouth recommendations to others.
We will develop and maintain a database of food inventory. From there we add specific information on each food, and an aggressive search engine positioning program. We use the database to make regular contact with email newsletters and notices about new arrivals, special offers, and referral services.
6.2 Development Requirements
The Tiffin Wallah website will be initially developed with few technical resources. A simple hosting provider, Wix Web services, will host the site and provide the technical back end.
*Please be advised all amounts are in Bangladeshi Taka, instead of US Dollar. 1 USD = 85 BDT
Tiffin Wallah will work with a contracted user interface designer (university student) to develop the simple, Internet-focused site. The Tiffin Wallah employees themselves will do the maintenance of the site. Tiffin Wallah can also look into pre-packaged solutions through Wix Web hosting.
Management Summary
Tiffin Wallah will start with four initial employees. The owner will manage over all operations and the sales manager will manage all buying and selling of inventory. A cook clerk and assistant attendant will also be hired initially.
Once the gross margin and cash flow will support it, we will hire an additional salesman and services attendants (tentatively four to six months).
7.1 Personnel Plan
The personnel plan and monthly salary is included in the following table. It shows the owner’s monthly salary of $3,500, followed by the sales manager of $2,500 plus a 20% (after cost) sales commission. The secretary/administration will earn $2,000 per month and the lot attendant is paid $1,200 per month. Bonuses will be paid for monthly sales that exceed forecasted sales, to all employees. As the business grows, additional salesmen and a services attendant will be added.
PERSONNEL PLAN
YEAR 1 YEAR 2 YEAR 3
Production Personnel
Owner/Manager $42,000 $50,000 $60,000
Other $0 $0 $0
SUBTOTAL $42,000 $50,000 $60,000
Sales and Marketing Personnel
Sales Manager $30,500 $35,000 $40,000
Other $0 $0 $0
SUBTOTAL $30,500 $35,000 $40,000
General and Administrative Personnel
Secretary/Records Admin $24,300 $26,500 $29,000
Service Attendant $14,550 $15,500 $16,500
Other $0 $0 $0
SUBTOTAL $38,850 $42,000 $45,500
Other Personnel
Accountant $2,000 $2,000 $2,000
Other $0 $0 $0
SUBTOTAL $2,000 $2,000 $2,000
TOTAL PEOPLE 0 0 0
Total Payroll $113,350 $129,000 $147,500
Financial Plan
1. Growth will be moderate to good, cash flows steady with several months of loss in 2021-2022.
2. Marketing will remain below 10% of sales.
3. The company will invest residual profits (10%) into financial markets and approximately 50% into company expansion for the first year. 8.1 Important Assumptions
We will accept credit cards and pre-tax salary. Credit cards will have a negative affect on cash flow in that we may not be paid for several days. Salary will also impact cash flow in that they are an asset and have no real value until received. We will have to limit the number of credit transactions, and only take in guaranteed salary at a premium price to facilitate a quick profit. The personnel burden is very low because benefits are not paid to part-timers. And the short-term interest rate is extraordinarily low because of current market rates.
We also assume conservative earnings from selling Meal-plans and extended buys will be made. The other assumption is that current market conditions will remain for the next two to three years. High income rates will have a positive impact on sales and more buys on the short term.
GENERAL ASSUMPTIONS
YEAR 1 YEAR 2 YEAR 3
Plan Month 1 2 3
Current Interest Rate 7.00% 7.00% 7.00%
Long-term Interest Rate 10.00% 10.00% 10.00%
Tax Rate 30.00% 30.00% 30.00%
Other 0 0 0
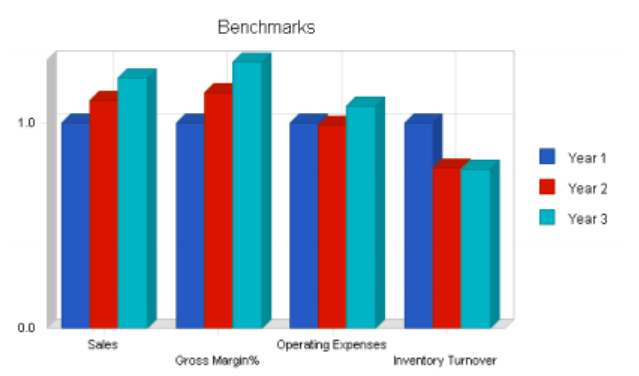
8.2 Key Financial Indicators
The following chart shows that inventory turnover speeds up as sales increase. This correlation is important when evaluating past inventory control techniques.
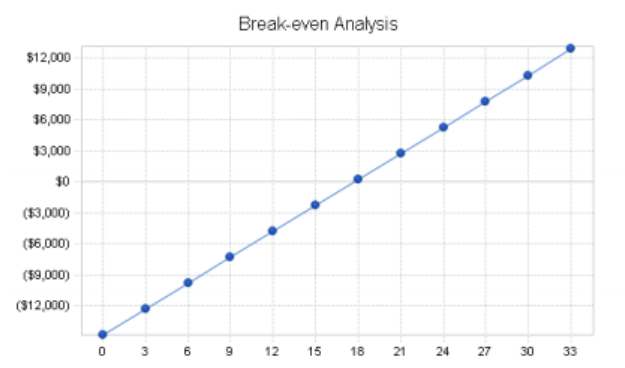
8.3 Break-even Analysis
The following break-even analysis table has been completed on the basis of average costs/prices. With average per unit sold costs and average variable costs as shown, the table calculates what we need to make per month, or sell in units, to break even each month.
BREAK-EVEN ANALYSIS
Monthly Units Break-even 18
Monthly Revenue Break-even $49,867
Assumptions:
Average Per-Unit Revenue $2,821.09
Average Per-Unit Variable Cost $1,983.11
Estimated Monthly Fixed Cost $14,813
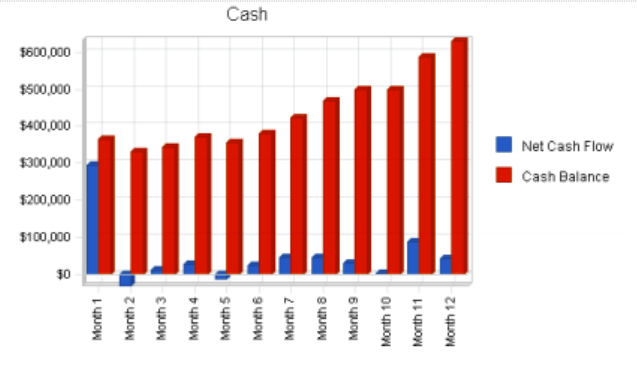
8.4 Projected Cash Flow
We are positioning ourselves in the market as a medium risk concern with steady cash flows. Accounts payable is paid at the end of each month, while sales generally in cash give Tiffin Wallah an excellent cash structure. Initial cash flow in July will be negative, there will be steady increases until October has a negative flow. Again a steady increase in positive cash flow until another slow loss in May. For year 2022-2023 we see a solid overall increase. All cash flow over 50% will be re-invested into the company. At least 10% of which will be invested in long-term assets. We will reserve up to 5% for bonuses, sales awards, and professional training.
PRO FORMA CASH FLOW
YEAR 1 YEAR 2 YEAR 3
Cash Received
Cash from Operations
Cash Sales $2,488,200 $2,750,200 $3,027,000
SUBTOTAL CASH FROM OPERATIONS $2,488,200 $2,750,200 $3,027,000
Additional Cash Received
Sales Tax, VAT, HST/GST Received $0 $0 $0 New Current Borrowing $150,000 $0 $0 New Other Liabilities (interest-free) $0 $0 $0 New Long-term Liabilities $30,000 $0 $0 Sales of Other Current Assets $0 $0 $0
Sales of Long-term Assets $0 $0 $0
New Investment Received $0 $0 $0
SUBTOTAL CASH RECEIVED $2,668,200 $2,750,200 $3,027,000
Expenditures Year 1 Year 2 Year 3
Expenditures from Operations
Cash Spending $113,350 $129,000 $147,500
Bill Payments $1,969,644 $2,181,397 $2,251,696
SUBTOTAL SPENT ON OPERATIONS $2,082,994 $2,310,397 $2,399,196
Additional Cash Spent
Sales Tax, VAT, HST/GST Paid Out $0 $0 $0
Principal Repayment of Current Borrowing $24,000 $24,000 $24,000
Other Liabilities Principal Repayment $0 $0 $0
Long-term Liabilities Principal Repayment $0 $0 $0
Purchase Other Current Assets $0 $0 $0
Purchase Long-term Assets $0 $0 $0
Dividends $0 $0 $0
SUBTOTAL CASH SPENT $2,106,994 $2,334,397 $2,423,196
Net Cash Flow $561,206 $415,803 $603,804
Cash Balance $629,006 $1,044,809 $1,648,613
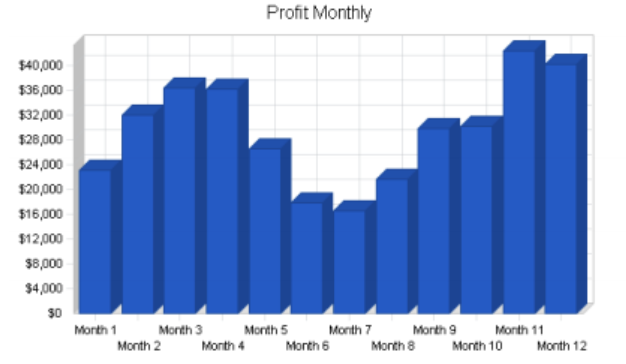
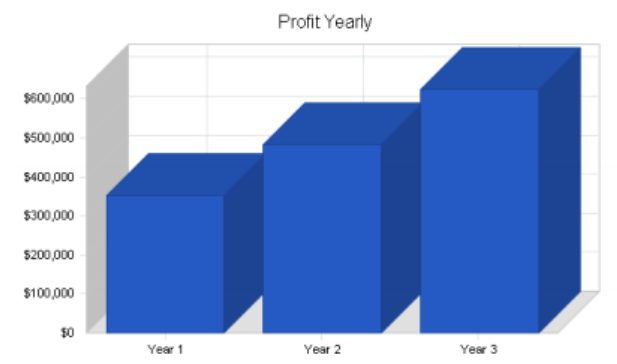
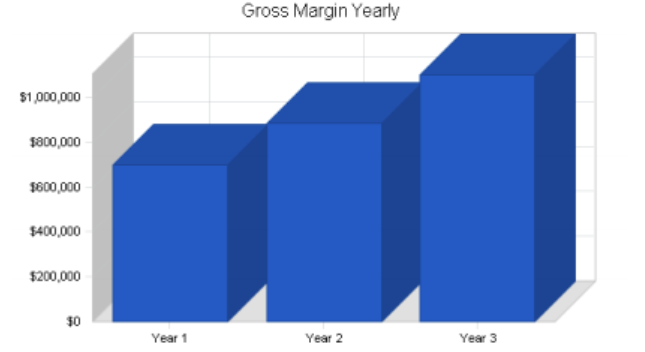
8.5 Projected Profit and Loss
The key to increasing overall sales is to focus on acquiring foods at, or below, wholesale price. Operating, advertising and consulting costs will increase at a slower rate than sales and profit in the next three years. Normally, a start-up company will operate with negative profits through the first two years. We predict a positive gross margin during 2023, increasing modestly to 2025. This optimistic projection is based on the sales strategy and market analysis. Projected sales will support continued operations, and final success will be based on actual sales and an increasing gross margin.
YEAR 1 YEAR 2 YEAR 3
Sales $2,488,200 $2,750,200 $3,027,000 Direct Cost of Sales $1,749,100 $1,815,500 $1,867,000 Production Payroll $42,000 $50,000 $60,000 Other Production Expenses $0 $0 $0 TOTAL COST OF SALES $1,791,100 $1,865,500 $1,927,000 Gross Margin $697,100 $884,700 $1,100,000 Gross Margin % 28.02% 32.17% 36.34% Operating Expenses
Sales and Marketing Expenses
Sales and Marketing Payroll $30,500 $35,000 $40,000 Advertising/Promotion $14,000 $5,000 $6,000 Web Page Maintenance $3,600 $2,500 $2,600 Cleaning/Maintenance $6,600 $6,000 $6,000 Travel/Auctions $3,200 $1,000 $2,000 Miscellaneous $0 $1,000 $1,000
TOTAL SALES AND MARKETING EXPENSES
$57,900 $50,500 $57,600
Sales and Marketing % 2.33% 1.84% 1.90% General and Administrative Expenses
General and Administrative Payroll $38,850 $42,000 $45,500 Sales and Marketing and Other Expenses $0 $0 $0 Depreciation $400 $500 $600 Leased Equipment $1,200 $1,500 $2,000 Utilities $6,000 $5,500 $6,000 Insurance $4,800 $5,000 $5,500 Rent $48,000 $48,000 $50,000 Payroll Taxes $17,003 $19,350 $22,125 Other General and Administrative Expenses $0 $0 $0
TOTAL GENERAL AND ADMINISTRATIVE EXPENSES
$116,253 $121,850 $131,725
General and Administrative % 4.67% 4.43% 4.35%
*Please be advised all amounts are in Bangladeshi Taka, instead of US Dollar. 1 USD = 85 BDT
Other Expenses:
Other Payroll $2,000 $2,000 $2,000 Consultants $0 $0 $0
Contract/Consultants-Accountant Review Books
$1,600 $1,200 $1,200
TOTAL OTHER EXPENSES $3,600 $3,200 $3,200
Other % 0.14% 0.12% 0.11%
Total Operating Expenses $177,753 $175,550 $192,525
Profit Before Interest and Taxes $519,348 $709,150 $907,475
EBITDA $519,748 $709,650 $908,075
Interest Expense $16,382 $17,980 $16,300
Taxes Incurred $150,890 $207,351 $267,353
Net Profit $352,076 $483,819 $623,823
Net Profit/Sales 14.15% 17.59% 20.61%
8.6 Projected Balance Sheet
As you can see in the projected balance sheet, our net worth will rise steadily each month and year. This is an increase in working capital and will fund future projects and expansion.
PRO FORMA BALANCE SHEET
YEAR 1 YEAR 2 YEAR 3
Assets
Current Assets
Cash $629,006 $1,044,809 $1,648,613
Inventory $210,100 $218,076 $224,262
Other Current Assets $0 $0 $0
TOTAL CURRENT ASSETS $839,106 $1,262,885 $1,872,875
Long-term Assets
Long-term Assets $0 $0 $0
Accumulated Depreciation $400 $900 $1,500
TOTAL LONG-TERM ASSETS ($400) ($900) ($1,500)
TOTAL ASSETS $838,706 $1,261,985 $1,871,375
Liabilities and Capital Year 1 Year 2 Year 3
*Please be advised all amounts are in Bangladeshi Taka, instead of US Dollar. 1 USD = 85 BDT
Current Liabilities
Accounts Payable $212,830 $176,290 $185,857 Current Borrowing $226,000 $202,000 $178,000 Other Current Liabilities $0 $0 $0 SUBTOTAL CURRENT LIABILITIES $438,830 $378,290 $363,857 Long-term Liabilities $30,000 $30,000 $30,000 TOTAL LIABILITIES $468,830 $408,290 $393,857 Paid-in Capital $30,000 $30,000 $30,000 Retained Earnings ($12,200) $339,876 $823,695 Earnings $352,076 $483,819 $623,823 TOTAL CAPITAL $369,876 $853,695 $1,477,518 TOTAL LIABILITIES AND CAPITAL $838,706 $1,261,985 $1,871,375 Net Worth $369,876 $853,695 $1,477,518
8.7 Business Ratios
RATIO ANALYSIS
YEAR 1 YEAR 2 YEAR 3 INDUSTRY
PROFILE
Sales Growth 0.00% 10.53% 10.06% 14.00% Percent of Total Assets
Inventory 25.05% 17.28% 11.98% 58.90% Other Current Assets 0.00% 0.00% 0.00% 28.10% Total Current Assets 100.05% 100.07% 100.08% 100.00% Long-term Assets -0.05% -0.07% -0.08% 0.00% TOTAL ASSETS 100.00% 100.00% 100.00% 100.00% Current Liabilities 52.32% 29.98% 19.44% 0.00% Long-term Liabilities 3.58% 2.38% 1.60% 0.00% Total Liabilities 55.90% 32.35% 21.05% 0.00% NET WORTH 44.10% 67.65% 78.95% 100.00% Percent of Sales
Sales 100.00% 100.00% 100.00% 100.00% Gross Margin 28.02% 32.17% 36.34% 18.90%
*Please be advised all amounts are in Bangladeshi Taka, instead of US Dollar. 1 USD = 85 BDT
Selling, General & Administrative Expenses 13.87% 15.62% 15.73% 10.20% Advertising Expenses 0.56% 0.17% 0.20% 1.30% Profit Before Interest and Taxes 20.87% 25.79% 29.98% 1.10% Main Ratios
Current 1.91 3.34 5.15 1.92 Quick 1.43 2.76 4.53 0.47 Total Debt to Total Assets 55.90% 32.35% 21.05% 55.55% Pre-tax Return on Net Worth 135.98% 80.96% 60.32% 55.55% Pre-tax Return on Assets 59.97% 54.77% 47.62% 8.90% Additional Ratios Year 1 Year 2 Year 3
Net Profit Margin 14.15% 17.59% 20.61% n.a Return on Equity 95.19% 56.67% 42.22% n.a Activity Ratios
Inventory Turnover 10.91 8.48 8.44 n.a Accounts Payable Turnover 10.25 12.17 12.17 n.a Payment Days 27 33 29 n.a Total Asset Turnover 2.97 2.18 1.62 n.a Debt Ratios
Debt to Net Worth 1.27 0.48 0.27 n.a Current Liab. to Liab. 0.94 0.93 0.92 n.a Liquidity Ratios
Net Working Capital $400,276 $884,595 $1,509,018 n.a Interest Coverage 31.70 39.44 55.67 n.a Additional Ratios
Assets to Sales 0.34 0.46 0.62 n.a Current Debt/Total Assets 52% 30% 19% n.a Acid Test 1.43 2.76 4.53 n.a Sales/Net Worth 6.73 3.22 2.05 n.a Dividend Payout 0.00 0.00 0.00 n.a
SALES FORECAST
MONTH 1
MONTH 2
MONTH 3
MONTH 4
MONT H 5
MONT H 6
MONT H 7
MONT H 8
MONT H 9
MONTH 10
MONTH 11
MONTH 12
*Please be advised all amounts are in Bangladeshi Taka, instead of US Dollar. 1 USD = 85 BDT
Unit Sales
Low-end foods 0% 20 25 30 30 25 20 18 20 25 25 30 30 Average foods 0% 12 15 15 15 12 10 10 11 12 12 15 15 High-end foods 0% 6 7 7 7 5 4 4 5 7 7 10 10 Meal-plan sales 0% 10 12 15 15 12 10 10 12 15 15 20 20 Holiday sales 0% 10 12 12 12 12 10 10 10 12 12 12 12
Other/consignment s
TOTAL UNIT SALES
0% 4 5 5 5 4 2 2 4 4 4 5 5 62 76 84 84 70 56 54 62 75 75 92 92
Unit Prices Month 1 Month 2 Month 3 Month 4 Month 5 Month 6 Month 7 Month 8 Month 9 Month 10 Month 11 Month 12
Low-end foods $2,000.00 $2,000.00 $2,000.00 $2,000.00 $2,000.0 0
Average foods $5,000.00 $5,000.00 $5,000.00 $5,000.00 $5,000.0 0
$2,000.0 0
$4,900.0 0
$2,000.0 0
$4,900.0 0
$2,000.0 0
$4,900.0 0
$2,000.0 0
$5,000.0 0
$2,000.00 $2,000.00 $2,000.00 $5,000.00 $5,000.00 $5,000.00
High-end foods $10,000.0 0
$10,000.0 0
$10,000.0 0
$10,000.0 0
$9,900.0 0
$9,800.0 0
$9,800.0 0
$9,900.0 0
$9,900.0 0
$10,000.0 0
$10,000.0 0
$10,000.0 0
Meal-plan sales $400.00 $400.00 $400.00 $400.00 $400.00 $400.00 $400.00 $400.00 $400.00 $400.00 $400.00 $400.00 Holiday sales $200.00 $200.00 $200.00 $200.00 $200.00 $200.00 $200.00 $200.00 $200.00 $200.00 $200.00 $200.00
Other/consignment s
Sales
$5,000.00 $5,000.00 $5,000.00 $5,000.00 $5,000.0 0
$5,000.0 0
$5,000.0 0
$5,000.0 0
$5,000.0 0
$5,000.00 $5,000.00 $5,000.00
Low-end foods $40,000 $50,000 $60,000 $60,000 $50,000 $40,000 $36,000 $40,000 $50,000 $50,000 $60,000 $60,000 Average foods $60,000 $75,000 $75,000 $75,000 $60,000 $49,000 $49,000 $53,900 $60,000 $60,000 $75,000 $75,000 High-end foods $60,000 $70,000 $70,000 $70,000 $49,500 $39,200 $39,200 $49,500 $69,300 $70,000 $100,000 $100,000 Meal-plan sales $4,000 $4,800 $6,000 $6,000 $4,800 $4,000 $4,000 $4,800 $6,000 $6,000 $8,000 $8,000 Holiday sales $2,000 $2,400 $2,400 $2,400 $2,400 $2,000 $2,000 $2,000 $2,400 $2,400 $2,400 $2,400
Other/consignment s
$20,000 $25,000 $25,000 $25,000 $20,000 $10,000 $10,000 $20,000 $20,000 $20,000 $25,000 $25,000
TOTAL SALES $186,000 $227,200 $238,400 $238,400 $186,700$144,200$140,200$170,200$207,700 $208,400 $270,400 $270,400 Direct Unit Costs Month 1 Month 2 Month 3 Month 4 Month 5 Month 6 Month 7 Month 8 Month 9 Month 10 Month 11 Month 12
Low-end foods 0.00 %
Average foods 0.00 %
High-end foods 0.00 %
$1,200.00 $1,200.00 $1,200.00 $1,200.00 $1,200.0 0
$3,500.00 $3,500.00 $3,500.00 $3,500.00 $3,500.0 0
$8,000.00 $8,000.00 $8,000.00 $8,000.00 $8,000.0 0
$1,200.0 0
$3,500.0 0
$8,000.0 0
$1,200.0 0
$3,500.0 0
$8,000.0 0
$1,200.0 0
$3,500.0 0
$8,000.0 0
$1,200.0 0
$3,500.0 0
$8,000.0 0
$1,200.00 $1,200.00 $1,200.00 $3,500.00 $3,500.00 $3,500.00 $8,000.00 $8,000.00 $8,000.00
*Please be advised all amounts are in Bangladeshi Taka, instead of US Dollar. 1 USD = 85 BDT
Meal-plan sales 0.00 %
Holiday sales 0.00 %
$0.00 $0.00 $0.00 $0.00 $0.00 $0.00 $0.00 $0.00 $0.00 $0.00 $0.00 $0.00 $0.00 $0.00 $0.00 $0.00 $0.00 $0.00 $0.00 $0.00 $0.00 $0.00 $0.00 $0.00
Other/consignment s
Direct Cost of Sales
0.00 %
$4,500.00 $4,500.00 $4,500.00 $4,500.00 $4,500.0 0
$4,500.0 0
$4,500.0 0
$4,500.0 0
$4,500.0 0
$4,500.00 $4,500.00 $4,500.00
Low-end foods $24,000 $30,000 $36,000 $36,000 $30,000 $24,000 $21,600 $24,000 $30,000 $30,000 $36,000 $36,000 Average foods $42,000 $52,500 $52,500 $52,500 $42,000 $35,000 $35,000 $38,500 $42,000 $42,000 $52,500 $52,500 High-end foods $48,000 $56,000 $56,000 $56,000 $40,000 $32,000 $32,000 $40,000 $56,000 $56,000 $80,000 $80,000 Meal-plan sales $0 $0 $0 $0 $0 $0 $0 $0 $0 $0 $0 $0 Holiday sales $0 $0 $0 $0 $0 $0 $0 $0 $0 $0 $0 $0
Other/consignment s
Subtotal Direct
Cost of Sales
PERSONNEL PLAN
$18,000 $22,500 $22,500 $22,500 $18,000 $9,000 $9,000 $18,000 $18,000 $18,000 $22,500 $22,500 $132,000 $161,000 $167,000 $167,000 $130,000$100,000 $97,600$120,500$146,000 $146,000 $191,000 $191,000
MONT
MONT
MONT
MONT
MONT
MONT
MONT
MONT
MONT
MONT
MONT
MONT
H 1
H 2
H 3
H 4
H 5
H 6
H 7
H 8
H 9
H 10
H 11
H 12
Production
Personnel
Owner/Manager $3,500 $3,500 $3,500 $3,500 $3,500 $3,500 $3,500 $3,500 $3,500 $3,500 $3,500 $3,500 Other $0 $0 $0 $0 $0 $0 $0 $0 $0 $0 $0 $0 SUBTOTAL $3,500 $3,500 $3,500 $3,500 $3,500 $3,500 $3,500 $3,500 $3,500 $3,500 $3,500 $3,500
Sales and
Marketing
Personnel
Sales Manager $2,500 $2,500 $2,500 $2,500 $2,500 $2,500 $2,500 $2,500 $2,500 $2,500 $2,500 $3,000 Other $0 $0 $0 $0 $0 $0 $0 $0 $0 $0 $0 $0 SUBTOTAL $2,500 $2,500 $2,500 $2,500 $2,500 $2,500 $2,500 $2,500 $2,500 $2,500 $2,500 $3,000 General and
*Please be advised all amounts are in Bangladeshi Taka, instead of US Dollar. 1 USD = 85 BDT
Administrative
Personnel
Secretary/Record s Admin
$2,000 $2,000 $2,000 $2,000 $2,000 $2,000 $2,000 $2,000 $2,000 $2,000 $2,000 $2,300
Lot Attendant $1,200 $1,200 $1,200 $1,200 $1,200 $1,200 $1,200 $1,200 $1,200 $1,200 $1,200 $1,350 Other $0 $0 $0 $0 $0 $0 $0 $0 $0 $0 $0 $0 SUBTOTAL $3,200 $3,200 $3,200 $3,200 $3,200 $3,200 $3,200 $3,200 $3,200 $3,200 $3,200 $3,650 Other Personnel
Accountant $500 $0 $0 $500 $0 $0 $500 $0 $0 $500 $0 $0 Other $0 $0 $0 $0 $0 $0 $0 $0 $0 $0 $0 $0 SUBTOTAL $500 $0 $0 $500 $0 $0 $500 $0 $0 $500 $0 $0
TOTAL PEOPLE
0 0 0 0 0 0 0 0 0 0 0 0
Total Payroll $9,700 $9,200 $9,200 $9,700 $9,200 $9,200 $9,700 $9,200 $9,200 $9,700 $9,200 $10,150 GENERAL ASSUMPTIONS
MONTH 1
MONTH 2
MONTH 3
MONTH 4
MONTH 5
MONTH 6
MONTH 7
MONTH 8
MONTH 9
MONTH 10
MONTH 11
MONTH 12
Plan
Month
Current Interest Rate
Long
term
Interest Rate
1 2 3 4 5 6 7 8 9 10 11 12 7.00% 7.00% 7.00% 7.00% 7.00% 7.00% 7.00% 7.00% 7.00% 7.00% 7.00% 7.00%
10.00% 10.00% 10.00% 10.00% 10.00% 10.00% 10.00% 10.00% 10.00% 10.00% 10.00% 10.00%
Tax 30.00% 30.00% 30.00% 30.00% 30.00% 30.00% 30.00% 30.00% 30.00% 30.00% 30.00% 30.00%
*Please be advised all amounts are in Bangladeshi Taka, instead of US Dollar. 1 USD = 85 BDT
Rate
Other 0 0 0 0 0 0 0 0 0 0 0 0 PRO FORMA PROFIT AND LOSS
MONT H 1
MONT H 2
MONT H 3
MONT H 4
MONT H 5
MONT H 6
MONT H 7
MONT H 8
MONT H 9
MONT H 10
MONT H 11
MONT H 12
Sales $186,000 $227,200 $238,400 $238,400 $186,700 $144,200 $140,200 $170,200 $207,700 $208,400 $270,400 $270,400 Direct Cost of Sales $132,000 $161,000 $167,000 $167,000 $130,000 $100,000 $97,600 $120,500 $146,000 $146,000 $191,000 $191,000 Production Payroll $3,500 $3,500 $3,500 $3,500 $3,500 $3,500 $3,500 $3,500 $3,500 $3,500 $3,500 $3,500
Other Production Expenses
TOTAL COST OF SALES
$0 $0 $0 $0 $0 $0 $0 $0 $0 $0 $0 $0 $135,500 $164,500 $170,500 $170,500 $133,500 $103,500 $101,100 $124,000 $149,500 $149,500 $194,500 $194,500
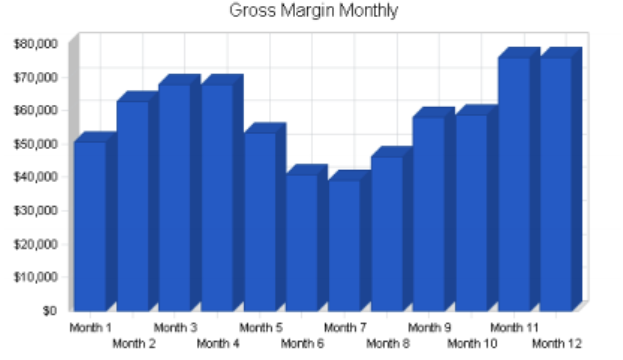
Gross Margin $50,500 $62,700 $67,900 $67,900 $53,200 $40,700 $39,100 $46,200 $58,200 $58,900 $75,900 $75,900 Gross Margin % 27.15% 27.60% 28.48% 28.48% 28.49% 28.22% 27.89% 27.14% 28.02% 28.26% 28.07% 28.07% Operating Expenses
Sales and Marketing
Expenses
Sales and Marketing Payroll
Advertising/Promotio n
Web Page
Maintenance
$2,500 $2,500 $2,500 $2,500 $2,500 $2,500 $2,500 $2,500 $2,500 $2,500 $2,500 $3,000 $2,000 $2,000 $1,000 $1,000 $1,000 $500 $500 $1,000 $1,000 $1,000 $1,000 $2,000 $400 $400 $400 $400 $200 $200 $200 $200 $200 $200 $400 $400
Cleaning/Maintenance $700 $700 $500 $500 $500 $500 $500 $500 $500 $500 $500 $700 Travel/Auctions $400 $400 $400 $200 $200 $200 $200 $200 $200 $200 $200 $400 Miscellaneous $0 $0 $0 $0 $0 $0 $0 $0 $0 $0 $0 $0
TOTAL SALES AND MARKETING EXPENSES
Sales and Marketing %
$6,000 $6,000 $4,800 $4,600 $4,400 $3,900 $3,900 $4,400 $4,400 $4,400 $4,600 $6,500 3.23% 2.64% 2.01% 1.93% 2.36% 2.70% 2.78% 2.59% 2.12% 2.11% 1.70% 2.40%
*Please be advised all amounts are in Bangladeshi Taka, instead of US Dollar. 1 USD = 85 BDT
General and
Administrative
Expenses
General and
Administrative
Payroll
Sales and Marketing and Other Expenses
$3,200 $3,200 $3,200 $3,200 $3,200 $3,200 $3,200 $3,200 $3,200 $3,200 $3,200 $3,650 $0 $0 $0 $0 $0 $0 $0 $0 $0 $0 $0 $0
Depreciation $100 $0 $0 $100 $0 $0 $100 $0 $0 $100 $0 $0 Leased Equipment $100 $100 $100 $100 $100 $100 $100 $100 $100 $100 $100 $100 Utilities $500 $500 $500 $500 $500 $500 $500 $500 $500 $500 $500 $500 Insurance $400 $400 $400 $400 $400 $400 $400 $400 $400 $400 $400 $400 Rent $4,000 $4,000 $4,000 $4,000 $4,000 $4,000 $4,000 $4,000 $4,000 $4,000 $4,000 $4,000
Payroll Taxes 15 %
Other General and
Administrative
Expenses
TOTAL GENERAL AND
ADMINISTRATIVE EXPENSES
General and
Administrative %
Other Expenses:
$1,455 $1,380 $1,380 $1,455 $1,380 $1,380 $1,455 $1,380 $1,380 $1,455 $1,380 $1,523 $0 $0 $0 $0 $0 $0 $0 $0 $0 $0 $0 $0
$9,755 $9,580 $9,580 $9,755 $9,580 $9,580 $9,755 $9,580 $9,580 $9,755 $9,580 $10,173 5.24% 4.22% 4.02% 4.09% 5.13% 6.64% 6.96% 5.63% 4.61% 4.68% 3.54% 3.76%
Other Payroll $500 $0 $0 $500 $0 $0 $500 $0 $0 $500 $0 $0 Consultants $0 $0 $0 $0 $0 $0 $0 $0 $0 $0 $0 $0
Contract/Consultants Accountant Review Books
TOTAL OTHER EXPENSES
$0 $0 $400 $0 $0 $400 $0 $0 $400 $0 $0 $400 $500 $0 $400 $500 $0 $400 $500 $0 $400 $500 $0 $400
Other % 0.27% 0.00% 0.17% 0.21% 0.00% 0.28% 0.36% 0.00% 0.19% 0.24% 0.00% 0.15%
*Please be advised all amounts are in Bangladeshi Taka, instead of US Dollar. 1 USD = 85 BDT
Total Operating Expenses
Profit Before Interest and Taxes
$16,255 $15,580 $14,780 $14,855 $13,980 $13,880 $14,155 $13,980 $14,380 $14,655 $14,180 $17,073 $34,245 $47,120 $53,120 $53,045 $39,220 $26,820 $24,945 $32,220 $43,820 $44,245 $61,720 $58,828
EBITDA $34,345 $47,120 $53,120 $53,145 $39,220 $26,820 $25,045 $32,220 $43,820 $44,345 $61,720 $58,828 Interest Expense $1,405 $1,393 $1,382 $1,370 $1,358 $1,347 $1,335 $1,323 $1,312 $1,300 $1,288 $1,568 Taxes Incurred $9,852 $13,718 $15,522 $15,503 $11,358 $7,642 $7,083 $9,269 $12,753 $12,884 $18,130 $17,178 Net Profit $22,988 $32,009 $36,217 $36,173 $26,503 $17,831 $16,527 $21,628 $29,756 $30,062 $42,302 $40,081 Net Profit/Sales 12.36% 14.09% 15.19% 15.17% 14.20% 12.37% 11.79% 12.71% 14.33% 14.42% 15.64% 14.82%
PRO FORMA CASH FLOW
MONTH
12
Cash Received
Cash from
Operations
MONTH 1
MONTH 2
MONTH 3
MONTH 4
MONTH 5
MONTH 6
MONTH 7
MONTH 8
MONTH 9
MONTH 10
MONTH 11
Cash Sales $186,000 $227,200 $238,400 $238,400 $186,700 $144,200 $140,200 $170,200 $207,700 $208,400 $270,400 $270,400
SUBTOTAL CASH FROM OPERATIONS Additional Cash Received
Sales Tax,
VAT, HST/GST Received
New Current Borrowing
New Other
Liabilities
(interest-free) New Long-term Liabilities
$186,000 $227,200 $238,400 $238,400 $186,700 $144,200 $140,200 $170,200 $207,700 $208,400 $270,400 $270,400
0.00% $0 $0 $0 $0 $0 $0 $0 $0 $0 $0 $0 $0
$100,000 $0 $0 $0 $0 $0 $0 $0 $0 $0 $0 $50,000 $0 $0 $0 $0 $0 $0 $0 $0 $0 $0 $0 $0
$30,000 $0 $0 $0 $0 $0 $0 $0 $0 $0 $0 $0
*Please be advised all amounts are in Bangladeshi Taka, instead of US Dollar. 1 USD = 85 BDT
Sales of Other Current Assets Sales of Long term Assets
New Investment Received
SUBTOTAL CASH
RECEIVED
$0 $0 $0 $0 $0 $0 $0 $0 $0 $0 $0 $0 $0 $0 $0 $0 $0 $0 $0 $0 $0 $0 $0 $0 $0 $0 $0 $0 $0 $0 $0 $0 $0 $0 $0 $0 $316,000 $227,200 $238,400 $238,400 $186,700 $144,200 $140,200 $170,200 $207,700 $208,400 $270,400 $320,400
Expenditures Month 1 Month 2 Month 3 Month 4 Month 5 Month 6 Month 7 Month 8 Month 9 Month 10
Expenditures
from Operations
Month 11
Month 12
Cash Spending $9,700 $9,200 $9,200 $9,700 $9,200 $9,200 $9,700 $9,200 $9,200 $9,700 $9,200 $10,150 Bill Payments $8,280 $247,395 $217,281 $199,345 $189,690 $109,426 $85,071 $113,011 $165,637 $195,852 $171,867 $266,790
SUBTOTAL SPENT ON OPERATIONS Additional Cash Spent
Sales Tax,
VAT, HST/GST Paid Out
Principal
Repayment of Current
Borrowing
Other Liabilities Principal
Repayment
Long-term
Liabilities
Principal
Repayment
$17,980 $256,595 $226,481 $209,045 $198,890 $118,626 $94,771 $122,211 $174,837 $205,552 $181,067 $276,940
$0 $0 $0 $0 $0 $0 $0 $0 $0 $0 $0 $0 $2,000 $2,000 $2,000 $2,000 $2,000 $2,000 $2,000 $2,000 $2,000 $2,000 $2,000 $2,000
$0 $0 $0 $0 $0 $0 $0 $0 $0 $0 $0 $0 $0 $0 $0 $0 $0 $0 $0 $0 $0 $0 $0 $0
Purchase Other $0 $0 $0 $0 $0 $0 $0 $0 $0 $0 $0 $0
*Please be advised all amounts are in Bangladeshi Taka, instead of US Dollar. 1 USD = 85 BDT Current Assets
Purchase Long term Assets
$0 $0 $0 $0 $0 $0 $0 $0 $0 $0 $0 $0
Dividends $0 $0 $0 $0 $0 $0 $0 $0 $0 $0 $0 $0
SUBTOTAL CASH SPENT
$19,980 $258,595 $228,481 $211,045 $200,890 $120,626 $96,771 $124,211 $176,837 $207,552 $183,067 $278,940
Net Cash Flow $296,020 ($31,395) $9,919 $27,355 ($14,190) $23,574 $43,429 $45,989 $30,863 $848 $87,333 $41,460 Cash Balance $363,820 $332,425 $342,344 $369,699 $355,509 $379,084 $422,513 $468,502 $499,365 $500,213 $587,546 $629,006 Need real financials?
PRO FORMA BALANCE SHEET
MONTH
12
Assets Starting
Balances
Current Assets
MONTH 1
MONTH 2
MONTH 3
MONTH 4
MONTH 5
MONTH 6
MONTH 7
MONTH 8
MONTH 9
MONTH 10
MONTH 11
Cash $67,800 $363,820 $332,425 $342,344 $369,699 $355,509 $379,084 $422,513 $468,502 $499,365 $500,213 $587,546 $629,006 Inventory $50,000 $145,200 $177,100 $183,700 $183,700 $143,000 $110,000 $107,360 $132,550 $160,600 $160,600 $210,100 $210,100
Other Current Assets
TOTAL
CURRENT ASSETS
Long-term Assets
Long-term Assets
Accumulated Depreciation TOTAL
LONG
TERM
ASSETS
$0 $0 $0 $0 $0 $0 $0 $0 $0 $0 $0 $0 $0 $117,800 $509,020 $509,525 $526,044 $553,399 $498,509 $489,084 $529,873 $601,052 $659,965 $660,813 $797,646 $839,106
$0 $0 $0 $0 $0 $0 $0 $0 $0 $0 $0 $0 $0 $0 $100 $100 $100 $200 $200 $200 $300 $300 $300 $400 $400 $400 $0 ($100) ($100) ($100) ($200) ($200) ($200) ($300) ($300) ($300) ($400) ($400) ($400)
*Please be advised all amounts are in Bangladeshi Taka, instead of US Dollar. 1 USD = 85 BDT
TOTAL ASSETS
$117,800 $508,920 $509,425 $525,944 $553,199 $498,309 $488,884 $529,573 $600,752 $659,665 $660,413 $797,246 $838,706
Liabilities and Capital
Current
Liabilities
Month 1 Month 2 Month 3 Month 4 Month 5 Month 6 Month 7 Month 8 Month 9 Month 10
Month 11
Month 12
Accounts
Payable
Current
Borrowing
Other Current Liabilities
SUBTOTAL CURRENT LIABILITIE S
Long-term Liabilities
TOTAL
LIABILITIE S
$0 $240,132 $210,628 $192,930 $186,013 $106,620 $81,363 $107,525 $159,077 $190,234 $162,921 $259,451 $212,830 $100,000 $198,000 $196,000 $194,000 $192,000 $190,000 $188,000 $186,000 $184,000 $182,000 $180,000 $178,000 $226,000 $0 $0 $0 $0 $0 $0 $0 $0 $0 $0 $0 $0 $0 $100,000 $438,132 $406,628 $386,930 $378,013 $296,620 $269,363 $293,525 $343,077 $372,234 $342,921 $437,451 $438,830
$0 $30,000 $30,000 $30,000 $30,000 $30,000 $30,000 $30,000 $30,000 $30,000 $30,000 $30,000 $30,000 $100,000 $468,132 $436,628 $416,930 $408,013 $326,620 $299,363 $323,525 $373,077 $402,234 $372,921 $467,451 $468,830
Paid-in Capital $30,000 $30,000 $30,000 $30,000 $30,000 $30,000 $30,000 $30,000 $30,000 $30,000 $30,000 $30,000 $30,000
Retained Earnings
($12,200 )
($12,200 )
($12,200 )
($12,200 )
($12,200 )
($12,200 )
($12,200 )
($12,200 )
($12,200 )
($12,200 )
($12,200 )
($12,200 )
($12,200 )
Earnings $0 $22,988 $54,997 $91,214 $127,386 $153,889 $171,721 $188,248 $209,875 $239,631 $269,693 $311,995 $352,076
TOTAL
CAPITAL TOTAL
LIABILITIE S AND
CAPITAL
$17,800 $40,788 $72,797 $109,014 $145,186 $171,689 $189,521 $206,048 $227,675 $257,431 $287,493 $329,795 $369,876 $117,800 $508,920 $509,425 $525,944 $553,199 $498,309 $488,884 $529,573 $600,752 $659,665 $660,413 $797,246 $838,706
Net Worth $17,800 $40,788 $72,797 $109,014 $145,186 $171,689 $189,521 $206,048 $227,675 $257,431 $287,493 $329,795 $369,876

