
Dr. Christopher Blair
BIO 4250
Molecular Evolution & Phylogenetics
Table of Contents
Models of molecular evolution
This week we are going to use the program IQ-TREE (Minh et al. 2020) to perform phylogenetic analyses using maximum likelihood (ML). ML and Bayesian methods are presently the most common approaches used to estimate phylogenetic trees. Both techniques require a model of sequence evolution that is used to calculate likelihood scores. In general, models have two components: (1) a matrix that includes parameters for the substitution from one nucleotide (or amino acid) to another; (2) base frequencies. Pages 424-427 in your textbook provide a good introduction to substitution models in phylogenetics. The simplest nucleotide model is the Jukes-Cantor model (JC69). This model assumes that the rate of substitution is the same between any pair of nucleotides (i.e. the rate from G to A is the same as C to T, A to C, etc.). The JC69 model also assumes that the bases occur at equal frequencies (25%). In contrast, the General Time Reversible model (GTR) assumes different rates of substitution between each pair of nucleotides. The GTR model also assumes different base frequencies. There are many models that fall in between the JC69 and the more parameter rich GTR (refer to the text for additional examples).
All substitution models can also include two additional parameters that account for different evolutionary rates in the multiple sequence alignment. One parameter accommodates the proportion of invariant sites (i.e. sites in which each individual/species share the same base). This parameter is denoted as ‘I’. The second parameter accommodates rate variation by assuming a gamma distribution of rates and a shape parameter alpha. This parameter is denoted as ‘G’. Thus, we can add +I, +G, or both to any model (e.g. GTR+I+G). In general, we need to balance model complexity and accuracy. We want to choose a model that adequately captures the variation in the data, but we do not want to use an overly complex model that introduces too many parameters. What we need is an objective way to select a substitution model for our analysis. Fortunately, this is easily done in several commonly-used software packages. IQ-TREE has a built-in function called ModelFinder (Kalyaanamoorthy et al. 2017) that we will use. Remember that a model of evolution is necessary to calculate the overall likelihood of a given phylogenetic tree and branch lengths.
ML analysis based on a single gene/locus
In this activity we will be performing ML phylogenetic analyses using both single locus and multilocus data sets. When we estimate a phylogeny using a single gene the resulting tree is referred to as a gene tree. This tree shows the evolutionary relationships among homologous gene copies sampled from each species. The topology of the gene tree may or may not be the same as the species tree, which depicts the evolutionary relationships among the taxa under study. For many questions in molecular evolution, the species tree is of primary interest. Today, there are many so-called “species tree” methods that seek to estimate the relationships of our species of interest, while accounting for the fact that gene tree topologies may differ. We will explore species trees later on in the semester. One commonly used technique is the concatenation method of species tree inference. Here, we simply combine multiple sequence alignments from individual genes into one long supermatrix, which is used as input to our ML analysis.
For our first exercise we will perform ML analysis on two data sets, the animals.phy data we used previously and the example2.phy data that contains mtDNA sequences from several animals.
ML analysis of animals.phy
Recall that these are homologous 18S sequences from several divergent animal phyla. These data were used to help determine the phylogenetic affinities of the strange Xenoturbella wormlike organism. I have gone ahead and performed a multiple sequence alignment (MSA) of the sequences using MUSCLE (Edgar 2004) in AliView (Larsson 2014). IQ-TREE should have already been installed on your computer. Note that IQ-TREE is a command line program with no graphical user interface. Thus, we need to open up a terminal window.
-
Click the magnifying glass in the upper right corner and type ‘terminal’ into the search bar. This will open the shell that we will use for our analysis.
-
Next, we need to navigate to the directory where the IQ-TREE executable is located (called iqtree2). We do this using the cd command in Unix. Make sure to place the data in the same directory as IQ-TREE.
-
Typing ./iqtree2 -h will bring up a list of all the available options in IQ-TREE. You will see that there are many options for analysis, but our goal here is to familiarize ourselves with the basics. Thus, we will not fiddle with most of the default values.
-
Run a simple ML analysis using the command ./iqtree2 -s animals.phy. This simple command will first use ModelFinder to determine the best evolutionary model for the data. This is accomplished by determining the likelihood (-LnL) score for each model and using information theoretic criteria (AIC, AICc, BIC) to choose the best model. Models with the lowest AIC, AICc and BIC values are generally the best.
-
You will notice that IQ-TREE deposited several output files in your working directory. The .log file is a summary of what is shown in your terminal window. This is a good file to have when you are writing up your methods section.
-
The .iqtree file contains the results of the analysis.
Q: How many sites are in your alignment?
How many sites are constant? How many are parsimony informative? Note that parsimony informative sites are sites where there are more than one base present, and each base is represented by at least two sequences.
Q: Which substitution model was chosen by ModelFinder? What was the weighted BIC score of the best model?
Q: What were the relative rates of substitution between bases based on the chosen model?
Q: What were the empirical base frequencies?
If you scroll to the bottom of the file you will see a graphic of the ML tree. Note that IQ-TREE infers unrooted phylogenies. However, in most cases we want to root the tree to infer the direction of evolutionary change. This is commonly done by using an outgroup. An outgroup is a species or set of species more distantly related to the ingroup, but not too distantly related as to make the comparison uninformative.
-
In your working directory you should see a file ending in .treefile. Open this file in the program FigTree. FigTree is a general viewer for phylogenetic trees that provides several good options for manipulation. First, make the species names larger and easier to read. Click the dropdown menu for Tip labels and increase the font size. Next, root the tree using the cnidarian (Nematostella vectensis). Click on the branch leading to this species and then click the Reroot button. Your tree should look like the following (Fig. 1).
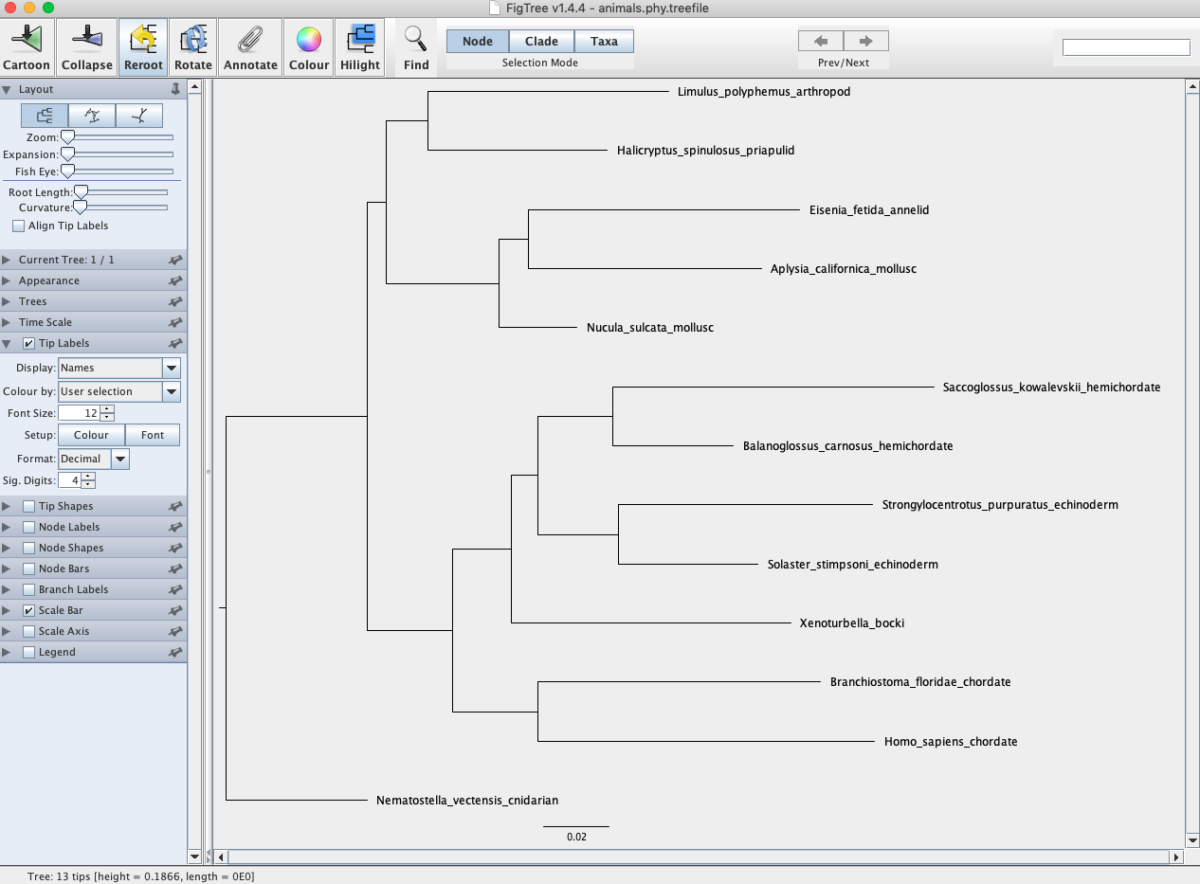
Fig. 1. Phylogenetic trees of animals inferred from maximum likelihood analysis of 18S sequences.
Q: Are all phyla monophyletic? Remember that monophyly is a grouping that includes the common ancestor and all descendants from that ancestor.
Q: What is the sister taxon to humans? What does this organism look like?
Q: Are protostomes and deuterostomes monophyletic?
Q: Does your analysis suggest that Xenoturbella is a protostome or deuterostome? Explain your reasoning.
Q: Does your analysis suggest that Xenoturbella is a mollusc?
Congratulations on performing your first ML phylogenetic analysis! In addition to the tree topology, we may be interested in determining how confident we are in the relationships based on our data. This can be accomplished by performing a non-parametric bootstrap analysis (refer to page 392 in your text). In brief, with bootstrapping we create x new pseudoalignments by sampling characters with replacement from the original MSA. A new ML analysis is conducted on each new alignment, and we then determine how often the same relationships are recovered in the bootstrap replicates versus the original alignment. For example, a bootstrap value of 100 means that a clade was found in all of the bootstrap trees. In general, bootstrap values >70 indicate strong support. Let’s perform 100 bootstrap replicates for our animal data.
-
Go back to your terminal window and enter the following command:
./iqtree2 -s animals.phy -b 100 -T AUTO
Here, the -b flag says that we want to conduct a standard non-parametric bootstrap analysis with 100 replicates. To utilize multiple computer threads we include the -T flag.
-
Go ahead and examine the .log and .iqtree files as before. This time, the tree image in the .iqtree file has bootstrap support mapped on the nodes. However, let’s look at the tree in FigTree.
-
Open the new .treefile in FigTree and process it the same as we did above (remember to re-root). To add bootstrap support, click the box for Branch Labels and then the drop down arrow. Under Display select label. You should now see bootstrap support values.
Q: Are the phylogenetic relationships strongly supported? Is there strong support for a protostome and deuterostome clade? Where is there weak support in your tree?
Q: Is there strong support for the placement of Xenoturbella? Does your analysis suggest that this is a mollusc? What is the sister group to Xenoturbella?
ML analysis of example2.phy
Next, work through the same pipeline yourself using the example2.phy alignment that consists of mtDNA sequences from several vertebrate species. Use the lungfish as the outgroup. See if you can ultimately reproduce the figure below (Fig. 2). Note that when performing a bootstrap analysis IQ-TREE will also provide a bootstrap consensus tree (.contree file). You can think of this as an average summary of all the bootstrap replicates. In general, researchers present the ML tree from the original data with the bootstrap values mapped on. This is all stored in the .treefile file.
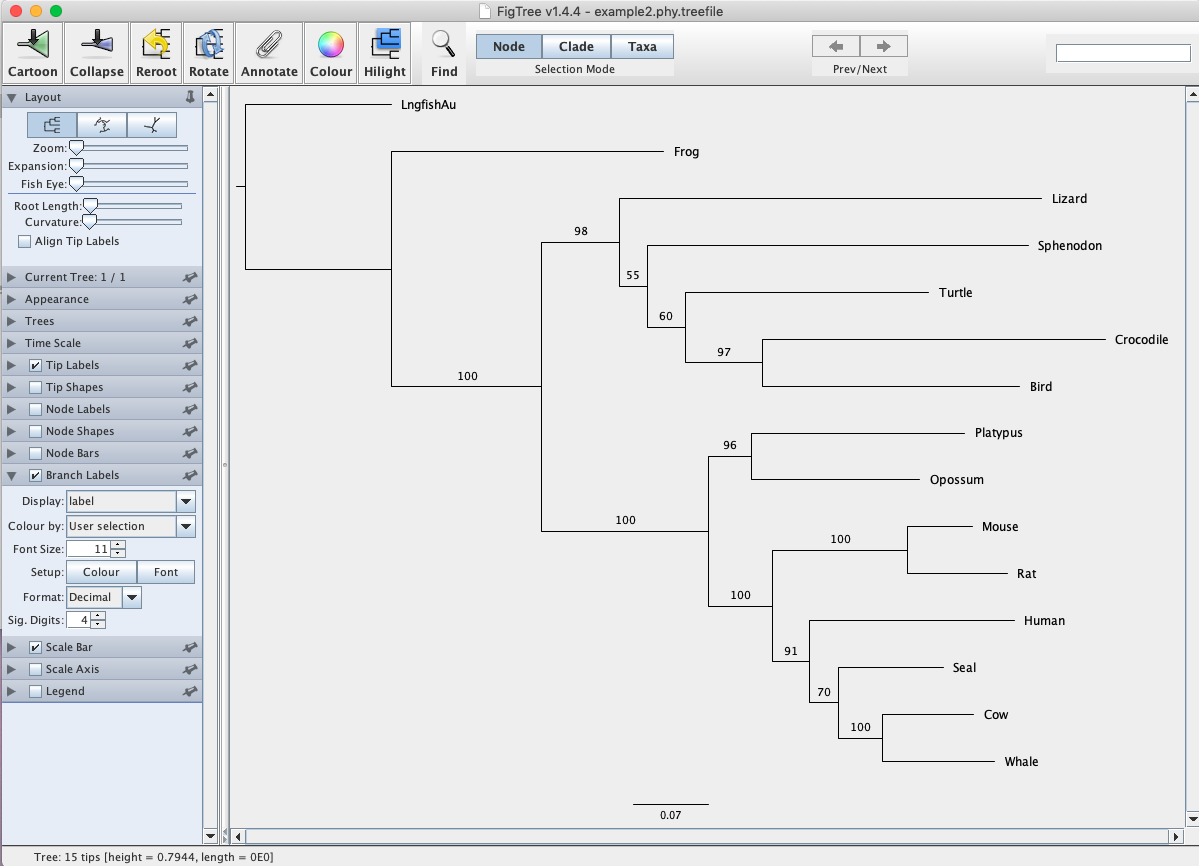
Fig. 2. ML phylogeny of vertebrates based on mtDNA sequences. Values at nodes represent non-parametric bootstrap support from 100 replicates.
Q: How long was your MSA? How many sites were constant? How many were parsimony informative?
Q: Which substitution model was selected for this data set? What was the BIC weight for the best model?
Q: Is your tree strongly supported? Where is there uncertainty?
Q: Is there strong support for the monophyly of mammals? How do you know?
Q: What is Sphenodon and where on Earth can we find it?
Q: Which group is the closest living relative of crocodiles? Do your data strongly support this conclusion?
Q: What is the sister group to humans?
ML analysis based on partitioned data
It is now common to base phylogenetic hypotheses off information from multiple genes. One traditional approach for this is to combine (concatenate) multiple genes together to form one long alignment (supermatrix). This supermatrix can then be analyzed using either an unpartitioned or a partitioned model. When we partition a concatenated alignment, we are allowing for different regions of the alignment to evolve under a different substitution model and set of parameters. Different programs have slightly different requirements for specifying a partition file. In IQ-TREE we can do this in either a NEXUS file or a RAxML-style file. Open the file example2.nex in a text editor and you will see the following.
#nexus
begin sets;
charset part1 = 1-999\3 2-999\3;
charset part2 = 3-999\3;
charset part3 = 1000-1998;
charpartition mine = HKY:part1, GTR+G:part2, GTR+G: part3;
end;
This is a NEXUS file that divides the alignment into three partitions. We will once again use the vertebrate mtDNA data as an example. If you open up the data (example2.phy) you can confirm that the length of the alignment is 1998 bp. Thus, all sites in the alignment have been assigned to a distinct partition. Our first partition consists of first and second codon positions. Remember that codons consist of three bases. Part2 is solely for the third position of codons. Finally, part3 consists of the remainder of the alignment. We can then name our partition scheme (‘mine’) and assign substitution models to each partition. Here, we are using the HKY model for part1, GTR+G for part2, and GTR+G for part3. Note that in this example we assign the same model to part2 and part3. This is NOT the same as lumping the two partitions and assigning a single GTR+G model. When we partition the data, IQ-TREE will provide separate parameter estimates for each partition. Let’s now run a partitioned ML analysis!
-
Make sure that the alignment (example2.phy), partition file (example2.nex) and IQ-TREE executable are all in the same directory.
-
Run the analysis using the following command:
./iqtree2 -s example2.phy -p example2.nex -b 100 -T AUTO –prefix example2_partitioned
which will perform a partitioned ML+bootstrap analysis using the models we provided in example2.nex. We added the prefix flag so we do not get confused with output files generated from the same data set under different analyses.
-
When finished, open up the .log file. You will notice that IQ-TREE loaded the three partitions just as we specified.
-
Open up the .iqtree file and you will also see your partitions and the models we assigned.
Q: What is the log-likelihood and BIC score for your tree?
-
Open up the tree if FigTree and process it the same as before.
Q: Is the tree identical to your previously unpartitioned analysis? If not, what are the differences?
In the previous example we a priori defined partitions and assigned substitution models to each. This is definitely one common approach to analyze concatenated alignments. A second approach is to statistically test what the best partition scheme is for your data. Once again, we start by dividing the data into biologically meaningful partitions. However, we can use IQ-TREE to test the fit of other partitions. For example, IQ-TREE uses the PartitionFinder algorithm (Lanfear et al. 2012) to merge our partitions to improve model fit. The algorithm stops when no better partition scheme can be found. Once the best partition scheme is detected, ModelFinder will select the best substitution model for each partition. Finally, IQ-TREE will perform a ML search using the best partition scheme and best substitution model(s). Note that the ModelFinder/PartitionFinder algorithm can only merge partitions, not split them further. Let’s run an analysis.
-
Run the following command:
./iqtree2 -s example2.phy -p example2.nex -m MFP+MERGE -b 100 -T AUTO –prefix example2_partitioned_ModelFinder
Notice that we added -m MFP+MERGE to our command. This is a very useful tool that will perform all of the following steps:
-
Determine if merging a priori defined partitions leads to a better model fit.
-
Select the best substitution model(s) for the best partition scheme.
-
Estimate a ML phylogeny using the best partition scheme and substitution model(s).
Note that we once again run 100 bootstrap replicates to assess confidence in our tree.
-
Carefully examine the .log and .iqtree files.
Q: What is the BIC score of the full partition model? What is the BIC score of the best partition model? What does this mean? What partition scheme and model were used for your final analysis?
Q: What is the log-likelihood and BIC score for your tree? According to BIC scores, is your first partitioned analysis (where you specified partitions and models) or your second (where you tested alternative partitions) better?
References
Edgar RC. 2004. MUSCLE: multiple sequence alignment with high accuracy and high throughput. Nucleic Acids Research 32, 1792-1797.
Kalyaanamoorthy S, Minh BQ, Wong TKF, von Haeseler A, Jermiin LS. 2017. ModelFinder: Fast model selection for accurate phylogenetic estimates. Nature Methods 14, 587-589.
Lanfear R, Calcott B, Ho SYW, Guindon S. 2012. PartitionFinder: Combined Selection of Partitioning Schemes and Substitution Models for Phylogenetic Analyses. Molecular Biology and Evolution 29, 1695-1701.
Larsson A. 2014. AliView: a fast and lightweight alignment viewer and editor for large datasets. Bioinformatics 30, 3276-3278.
Minh BQ, Schmidt HA, Chernomor O, Schrempf D, Woodhams MD, von Haeseler A, Lanfear R. 2020. IQ-TREE: New models and efficient methods for phylogenetic inference in the genomic era. Molecular Biology and Evolution 37, 1530-1534.
Print this page
