Katherine Rosero
Final Lab Report: Phenylthiocarbamide Genetics
Abstract:
The ability to taste phenylthiocarbamide is a polymorphic trait that has long been studied. There are many ways by which to test for the allelic variance in humans. By method of self-assessment, amplicon sequencing and restriction enzymes, the genotype or phenotype of the individual being tested can be found. After performing all three previously mentioned methods, it was shown that there was all three possible combination of alleles (homozygous dominant, homozygous recessive, and heterozygous) in the sample size of the class.
Introduction:
In his 1932 publication “The Relationship between Chemical Constitution and Taste”, Arthur L. Fox noted what he called a “peculiar phenomenon” (Fox, 115) when working with phenylthiocarbamide or PTC. Another occupant of the lab remarked about the bitter taste of the compound, while Dr. Fox himself found it to be tasteless. Since this discovery there have been a multitude of experiments done to study the difference in ability to taste the PTC compound. Studies suggest that the trait follows a Mendelian pattern of inheritance (Whissell-Buechy, 15:39–57), where “T” is the taster allele, and “t” is the non-taster allele. Although the ability to taste the bitterness of PTC might not have any value in today’s society, it is believed that the ability to taste bitterness in poisonous plants and fruits was a valued trait in the long-gone hunter-gatherer society humans once lived in. As found in a 2015 study, today the ability to taste PTC might be more linked to the like or dislike of foods containing the compound such as wine, cabbage, broccoli and pepper (Pandolfi, 7-12).
Methods:
The first step was to determine whether the participants were tasters or non-tasters phenotypically. This was done by the use of PTC paper. Small strips of paper were presoaked in phenylthiocarbamide and the participants were asked to place the strips on their tongue. Data on the participants self-assessed ability to taste PTC was recorded.
Next, DNA was extracted from participants epithelial cheek cells. This was done by using sterile cytobrushes and brushing the inside of the cheek vigorously 25 times. The cytobrush was then swirled into 100 ml Chelex suspension and heated at 100° C for ten minutes. After heating, the suspension was centrifuged at maximum speeds for five minutes and stored at temperatures of -20 ° C until used.
Polymerase chain reaction (PCR) method was then used to amplify a 221 base pair fragment of the gene of interest, TAS2R38. This was achieved by combining a primer mix consisting of forward primers, reverse primers and loading dye to PCR tubes containing PCR beads. The DNA extracted in the previous step was added and the samples were loaded into the thermocycler and run. The resulting amplicon product was then transferred into two separate microcentrifuge tubes, one for digested PCR product and one for undigested PCR product. The tube labeled digested was then treated with HaeIII restriction enzyme which cleaved the amplicon at the GGCC nucleotide sequence.
An agarose gel was cast, and both digested and undigested amplicons along with a size marker were placed in the gel for gel electrophoresis. Below is an image of the configuration of the amplicons and marker within the gel (Figure 1). The remaining undigested PCR product was then sent out for Sanger sequencing by a third-party company.
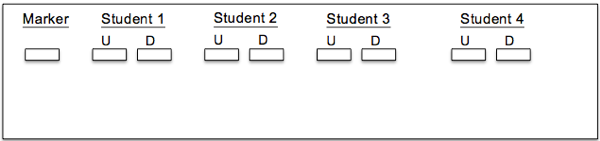
Figure 1: Visual representation of Gel configuration
Results:
From the self-assessment of the ability to taste PTC from the 15 participants, 5 claimed to be strong PTC tasters, 7 weak PTC tasters, and 3 non-tasters. This resulted in a frequency of 0.33, 0.466 and 0.20 for strong, weak, and non-tasters respectively as represented in Figure 2.
| Phenotype | Number of Students | Observed Frequency |
| Strong PTC Taster | 5 | 0.333 |
| Weak PTC Taster | 7 | 0.466 |
| Non-Taster | 3 | 0.20 |
| Total | 15 | 1.0 |
Figure 2: Class data for PTC tasting
The results from the gel electrophoresis are shown below (Figure 3). For all students the undigested product showed the same result of being 221 base pairs. Student 1 and student 4 are both shown to be strong tasters (TT), where in the digested product there is a clear separation at 177th bp and 44th bp. While student 2 and student 3 are both non-tasters(tt), as their digested and undigested product show the same banding pattern and are 221bp in length.
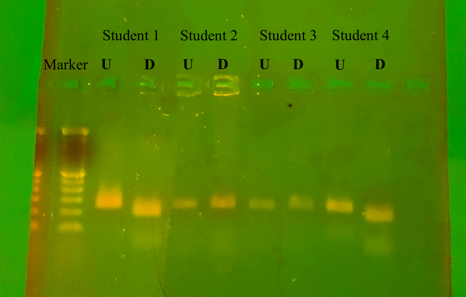
Figure 3: Gel Electrophoresis results U = undigested, D = digested by HaeIII
From the amplicon product sent for Sanger sequencing the results for Student 1 (strong taster) are shown below (Figure 4). Beginning at the 149th bp and ending at the 159th bp, the reverse complement of the known strong taster (TT) sequence can be observed. Even more specifically, at the 153rd bp the presence of cytosine confirms the strong taster allele versus the non-taster allele that would show a guanine substitution at that position.
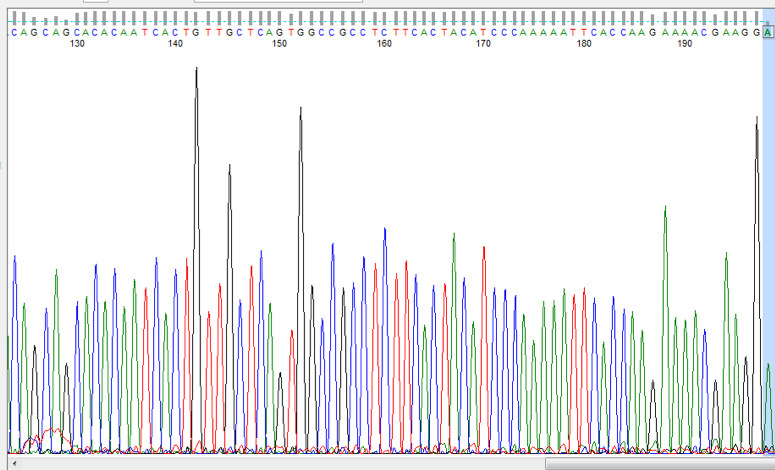
Figure 4: Sanger sequencing for Student 1 shown on FinchTV
Discussion:
The ability to taste the bitterness of phenylthiocarbamide is polymorphic, and the results obtained from all three methods of testing used in the lab confirm this. The class with a small sample size showed a variability for the ability to taste PTC. The division of the tasters and weak tasters to non-tasters in the class cannot be compared to an expected value due to the fact that previous studies have shown there is large variance in the population who can taste and not taste. The range of percentage of non-tasters in the worldwide population is large; ranging from 1.3% in native Nicaraguans (De Stefano et. al, 371-373) to a high of 66.7% in the Wad Balgei population of India (Agrawal, 111-113). This variation was also shown in the results of the gel that was ran. With the 4 students shown, there was a 50% split between tasters and non-tasters. It was seen on the gel that both non-tasters had no cuts in their amplicon sequence, due to the lack of GGCC sequence that HaeIII recognizes to cut. It is also this same GGCC sequence beginning at the 153rd bp that denotes a taster, making students 2 and 3 homozygous recessive for the allele. Students 1 and 4, who both stated to be strong tasters in the self-assessed PTC paper test, show cuts in their amplicons. This can be seen on the digested bands. The first band from the top is lower than the uncut 221 bp and sits at about 177bp long according to the ladder placed in the first well. A second much fainter band can also be seen for both strong taster students at approximately the 44 bp marker. The cuts in the amplicon without a third band still at the 221bp marker verify that both students are homozygous dominant, TT, for the tasting allele.
The Sanger sequencing also confirmed student 1 to be a strong taster. This is apparent by the observed reverse complementary sequence to the known strong taster sequence being present. However, the Sanger sequencing cannot verify homozygosity at this allele due to only one copy of the amplicon being sequenced. It is possible that someone who showed the same result to student 1 on the Sanger sequencing be heterozygous at the interested loci.
References:
Fox, A L. “The Relationship between Chemical Constitution and Taste.” Proceedings of the National Academy of Sciences of the United States of America vol. 18,1 (1932): 115-20. doi:10.1073/pnas.18.1.115
Whissell-Buechy, D. “Genetic basis of the phenylthiocarbamide polymorphism.” Chemical senses 15.1 (1990): 27-37.
De Stefano, Gian Franco, and Jorge Jenkins Molieri. “PTC tasting among three Indian groups of Nicaragua.” American journal of physical anthropology 44.2 (1976): 371-373.
Agrawal, H. N. “A short note on a study of ABO blood groups, PTC test sensitivity, middle phalangeal hairs and sickle cell traits among the Wad Balgei of Andhra Pradesh.” Bulletin of Anthropological Survey of India 13 (1964): 111-113.
Pandolfi, M., Chow, C., Higashi, L., Fonseca, A., Cunha, M., France, C., & Colombo-Souza, P. (2015). Taste sensitivity to phenylthiocarbamide and its relationship to food preferences. Journal of Medicine, UFC, 55 (1), 7-12.