In 2012 scientist at the Large Hadron Collider announced the discovery of the Higgs boson. The Higgs had been predicted to exist over 50 years earlier as a way to explain how all particles get their masses. The discovery took so long because the Higgs is rather massive and required a very high energy particle collider with high luminosity to have a chance of seeing it. This was the main argument for the construction of the Large Hadron Collider.
In 2012 this figure was shown at an internal meeting of the Atlas detector, showing evidence of the Higgs boson. I have used plotdigitizer.com to create this datafile with the values from the plot.
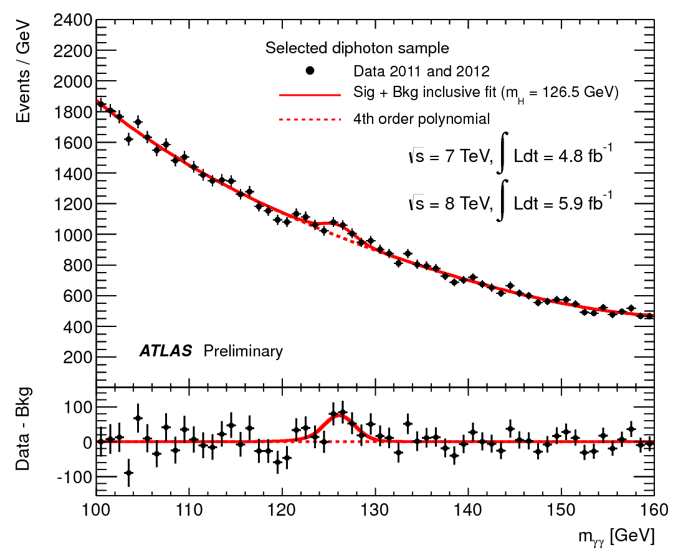
For this lab use ordinary linear least squares to fit the data, numpy.poly_fit(). Use a linear model, quadratic and 4th order polynomial. Record the sum of the squares of the residuals in each case, SSres. Calculate the chi square p-value for each fit. You will find they are incredibly small because the variance of each data point is not unity. We can see that by the plotted error bars. In fact the error bars are clearly mass dependent and can be approximated with the formula, σ = (160 – mγγ)/3.0 + 20. Fit the data points a 2nd time, but this use a weighted fit and calculate a weighted chi square. Now what are the p-vals you get for each fit?
Make a plot of the residuals for the 4th order polynomial as shown in the above figure. You should see a bump around 126 Gev. Just taking 8 or so points around the bump, fit a Gaussian to the residuals using nonlinear least squares, scipy.optimize.curve_fit(). You will need 3 nonlinear parameters, the mean of the Gaussian, the width (standard deviation) and its amplitude. What is your value of chi square for this fit?

