Below is a gif which may help you visualize the graphs of the sine and cosine functions in terms of their “unit circle definitions.”
First, here’s a reminder of the definitions of sine and cosine in terms of the unit circle: sin t is the y-coordinate of the corresponding point on the unit circle, and cos t is the x-coordinate (where t is the angle measured in radians).

Now look at the graphs of the coordinates as the point rotates around the circle:
(By LucasVB (Own work) [Public domain], via Wikimedia Commons)
Here’s what’s going on: if you look at the unit circle part, the blue dot is at the x-coordinate of the point of the unit circle–and hence the blue graph is the graph of  .
.
Similarly, the red dot is at the y-coordinate of the point of the unit circle, and hence the red graph is the graph of  .
.
(Watch one full “period”–from when the angle  is at the 0 position until it goes all the way around the circle. You’ll the graphs trace out one full cycle of the sine and cosine waves (i.e., over the interval [ 0, 2 pi].
For an interactive version, click through on the image below for a Desmos graph:
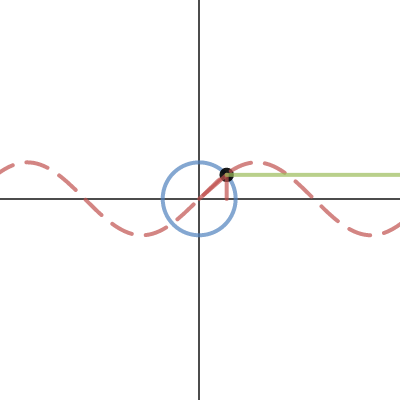


