Author Archives: Suman Ganguli

Guide to the Final Exam (Review Sheet)

As I have been saying over the course of the semester, you should work through the Final Exam Review exercises before the final exam (coming up on Monday Dec 21).

Below is a guide to the exercises/topics on the final exam review sheet, with similar exercises from the quizzes and exams listed. Look at the solutions of the exams and quizzes for further review as you work through the Final Exam Review exercises! (All the solutions have been uploaded here.)

Specifcally, here’s what I recommend you do to prepare for the final:

  • Print out the Final Exam Review sheet; you could also print out the quiz and exam solutions
  • Go through the outline below and work through each of the Final Exam Review topics (ideally do 2 or 3 topics each day–it’s too much to try do it all in one day!)
    • Try to do the Final Review exercise
    • If you can’t remember how to do that kind of problem, go through the solutions of the corresponding Quiz and Exam questions
    • Then try the Final Exam Review exercise again, using the quiz and/or exam solution as a guide
    • To incentivize you to actually do them, I’ve assigned a handful of Final Exam Review exercises for HW#10

#1: Polynomial and rational function inequalities

  • Use the graph of the function on the LHS of the inequality to find the interval(s) where the function is greater than or less than 0 (i.e., where the graph above or below the x-axis).
  • For inequalities involving a quadratic polynomial, such (a)-(c), solve for the roots of the quadratic by factoring (or by using the quadratic formula). This gives you the x-intercepts of the graph, i.e., it tells you exactly where the graph crosses the x-axis.
  • For inequalities involving a rational function, such as (d), solve for the x-intercept (by solving where the numerator equals 0), but you’ll also need to solve for the vertical asymptote (by solving where the denominator equals 0). Then look at the graph of the rational function.
  • See Exam 2, #6


#2: Absolute value inequalities

  • If the inequality is \lvert mx + b \rvert < c, then solve - c < mx + b < c
  • If the inequality is \lvert mx + b \rvert > c, then solve mx + b < -c and solve mx + b > c
  • See Quiz 1, #1 and Exam 1, #1
  • See also the video posted here


#3: Rational Functions

  • Find the x- and y-intercepts algebraically, the domain, the vertical and horizontal asymptotes (see this post for an outline of how to do all that algebraically!)
  • Graph the function using a graphing calculator and the information above
  • See Exam 2, #4 & #5


#4: Difference Quotients

  • Find f(x+h)  in order to set up and simplify the difference quotient \frac{f(x+h) - f(x)}{h} (in particular for quadratic polynomials, i.e., f(x) = ax^2 + bx + c)
  • See Quiz 1, #2 and Exam 1, #2
  • See also the videos posted here


#5: Polynomials

  • Find the roots of a polynomial algebraically (using a combination of techniques: by identifying an integer root at x=c and using long division by (x-c); by factoring; by using the quadratic equation)
  • Graph the function using a graphing calculator and the roots
  • See Quiz 2, #2 and Exam 2, #3


#6: Vectors

  • Find the magnitude and direction angle of a vector
  • See Example 22.4 on pp301-302 of the textbook


#7: Skip this since we didn’t have time to cover this topic


#8: Properties of Logarithms

  • Simplify logarithmic expressions using the properties of logarithms
  • See Quiz 3, #2 and Exam 3, #2


#9: Graphing logarithmic functions

  • Finding the domain, asymptote and x-intercept of a logarithmic function, and sketching its graph
  • See Quiz 3, #1 and Exam 3, #3


#10: Amplitude, period, phase shift of a trigonometric function

  • See Exam 3, #7


#11: Solving trigonmetric equations


#12 and #13: Exponential population growth

  • Write down the function P(t) = P_0 (1+r)^t given the initial population P_0 and the rate r at which the population is growing (or decreasing, as in #12!)
  • Solve for the time it takes for the population to grow (or decrease) by a certain multiple (i.e., to double to 2*P_0)
  • See Exam 3, #5
  • See also this post


#14: Find the inverse of a given function

  • Given y = f(x), switch x and y, and solve for y in terms of x
  • See Exam 1, #6 and Quiz #2, #1

#15: Sums of arithmetic sequences

  • Given an arithmetic sequence, where each successive term is found by adding a constant “difference” d the previous term (i.e., a_{i+1} = a_i + d for all > 1), identify the initial term a_1 and the constant d
    • For example: given the sequence 25,21,17,13,9,5, \ldots, we see that a_1 = 25 and d = -4
  • Use the following formulas to calculate the sum of the 1st k terms of the sequence:
    • the k-th term of the sequence a_k is given by the formula a_k = a_1 + (k-1)*d
    • then use the formula for the sum of the 1st k terms of the sequence: \Sigma_{i=1}^k a_i = \frac{k}{2}(a_1 + a_k)
  • For example, to calculate the sum of first 83 terms of the arithmetic sequence 25,21,17,13,9,5, \ldots:
    • first we calculate that the 83rd term in the sequence is a_{83} = a_1 + (k-1)*d = 25 + (83-1)*(-4) = 25-328 = -303 and so
    • the sum of the first k = 83 terms is \Sigma_{i=1}^{83} a_i = \frac{83}{2}(25 - 303) = -11,537
  • See also Example 23.15(c) on pp321-322 of the textbook
  • The formulas above are on p318 and p321, respectively


#16: Sums of infinite geometric sequences

  • Given a geometric sequence with initial term a_1 and constant “ratio” r, i.e., each successive term is found by multiplying the previous term by r (so a_{i+1} = a_i * r for all i > 1), identify the constant r
  • Then use the following formula to calculate the sum of an infinite geometric sequence: \Sigma_{i=1}^k a_i = a_1 * \frac{1}{1-r}
  • For example, given the sequence -6, 2, -\frac{2}{3}, \frac{2}{9}, -\frac{2}{27}, \ldots, we see that r =-\frac{1}{3}, with a_1 = -6
  • Hence, 1-r = 1 - (-1/3) = 1 + (1/3) = 4/3, and so \frac{1}{1-r} = 3/4, and thus the sum of this geometric series is a_1 * \frac{1}{1-r} = -6*(3/4) = -18/4 = -9/2.
  • See also Example 24.10(c) on pp332-333 of the textbook

#17: Skip this since we didn’t have time to cover this topic


Exponential Population Growth (& World Population Growth Rates)

This post follows up on the question on Exam #3, regarding an exponential model for the world’s population. The first part is a review of the math we’ve discussed for exponential population growth (or decay) models. The second part discusses

Part I: Exponential Population Growth

This “mathematical model” of population growth assumes that the population in question grows (or decreases) at a constant rate over every time period. For example, on the exam, you were asked to assume that the world’s population is growing at a rate of 1.2% every year.

Given such a constant growth rate, we discussed why the resulting model is an exponential growth model, with the population at time t given by the function

P(t) = P_0 (1+r)^t

where r is the constant growth rate (as a decimal, e.g., r = 1.2% = 0.012 on the exam question), and P_0 is the initial population.

Hence, the function for the exam question, where the initial (current) population was given as 7 billion, is

P(t) =7 (1.012)^t

(In the notation of the textbook,

f(x) = c (1+r)^x, where c is the initial population.)

A typical exercise is to solve for the amount of time it takes for the population to double, in which case we need to solve the following equation for t:

P(t) =P_0 (1+r)^t = 2*P_0

We can solve for t do this by canceling the factor ofP_0, and then taking the logarithm of both sides and applying the log properties to “bring down” the variable t, so that we have

t \log (1+r) = \log 2 \Longrightarrow t = \frac{\log 2}{\log (1+r)}

(Compare with the solutions to Exam 3, with the specific numbers for that exercise plugged in.)

Part II: World Population Growth Rates

(To be updated!  I’ll expand on the discussion we had in class on Monday, based on the data found on http://www.worldometers.info/world-population)

Exam 3 Review

Exam #3 will be this Wednesday (Dec 9). Here is an outline of topics that will be covered on the exam, with specific examples and exercises to review.  Also review the examples we did in class from your notes.

Ch 13 – Logarithmic functions
  • Computing simple logarithms: Example 13.10, Exercise 13.4
  • Graphing logarithmic functions (and finding their domains, x-intercepts, vertical asymptotes): Example 13.13, Exercise 13.6(a)-(d), Final Exam Review #9, Quiz 3 #1
Ch 14 – Properties of logarithmic functions
  • Using the log properties to write logarithmic expressions in terms of elementary logarithms: Example 14.3, Exercise 14.2(a)-(d), Final Exam Review #10, Quiz 3 #2
  • Solving equations using logarithms: Example 14.5, Example 14.6, Exercise 14.4(a)-(c), Exercise 14.5(a)-(c)
Ch 15 – Application of exponentials/logarithms to exponential population growth
  • Example 15.8, Exercises 15.4 & 15.6, Final Exam Review #12 & #13
Ch 17: Trigonmetric Functions
  • amplitude/period/phase shift and graphs of trig functions: Example 17.10, Exercise 17.6(a)-(d), Final Exam Review #10
Ch 20: Solving Trig Equations

Example: Solving Simple Trigonmetric Equations

Here are a couple of the examples we went through in class, regarding how to solve simple trigonometric equations.  We find the solution sets using both the graph of the function and the unit circle:

Example 1: Solve sin x = 0:

The solutions of this equation correspond to the x-intercepts of the graph of y = sin x.

(Make sure you understand why: the graph of a function y = f(x) intersects the x-axis exactly when f(x)=0!)

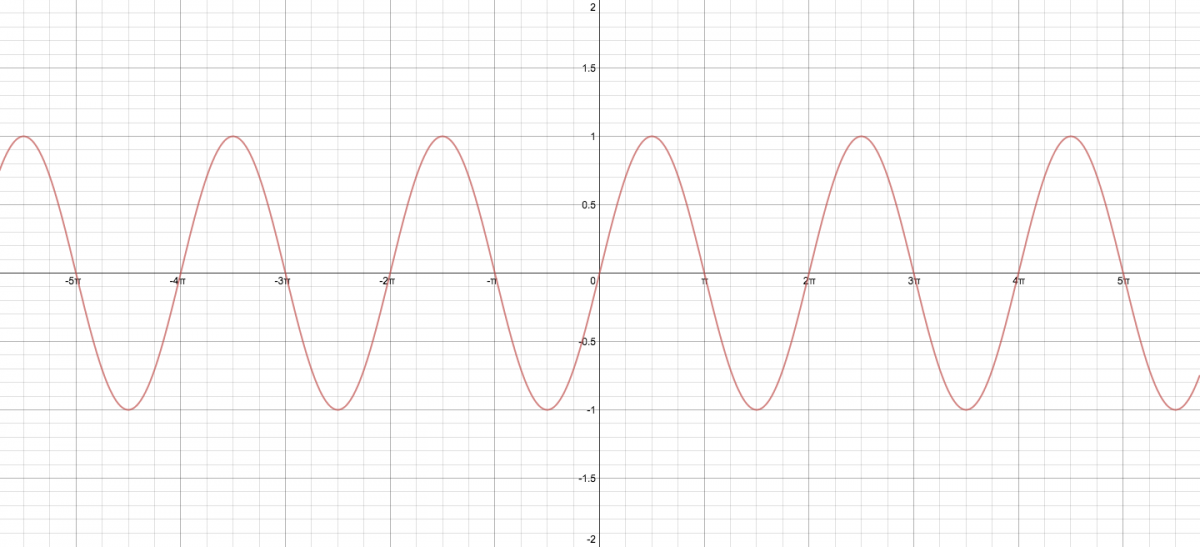
Here is the graph of y = sin x:

sine

We see that the x-intercepts of y = sin x occur at x = 0, \pm \pi, \pm 2 \pi, \pm 3 \pi, \ldots, \pm n \pi, \ldots (for any integer n).  Hence that is the solution set of the equation

(Click on the graph to enlarge it–or better, make your own graph in Desmos!)

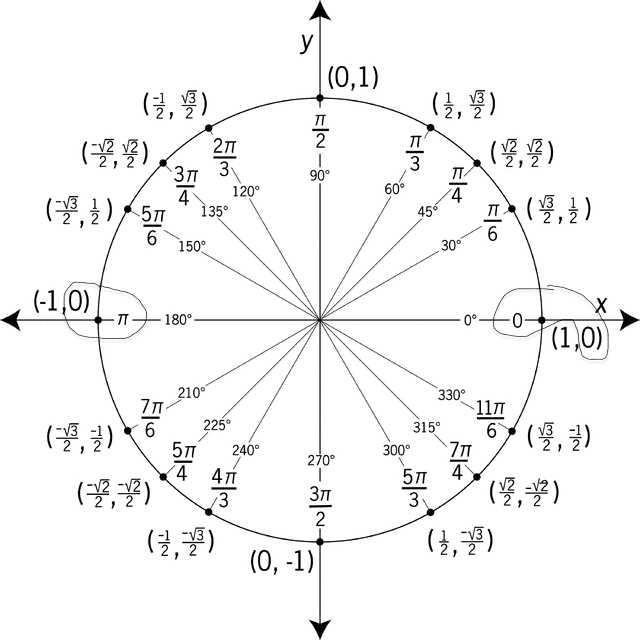
We can also get this solution set from the unit circle. To find the solutions of sin x = 0, we want o find the angles on the unit circle such that the y-coordinate of the point equals 0. Looking at the unit circle below, we see this occurs at the angles 0 and \pi (circled):


unit-circle-trig copy


But we also hit those same points, and hence the same values of the sine function, when we go around the circle a full revolution in either direction, i.e., if we add or subtract any integer multiple of 2 \pi to these two basic solutions.

Hence, the complete solution set consists of
x = 0, 0 \pm 2 \pi, 0 \pm 4 \pi, \ldots, 0 \pm 2 \pi n, \ldots and
x = \pi, \pi \pm 2 \pi, \pi \pm 4 \pi, \ldots, \pi \pm 2 \pi n, \ldots

Combining these, we see that get the same solution set as above:

x = 0, \pm \pi, \pm 2 \pi, \pm 3 \pi, \ldots, \pm n \pi, \ldots (where n = 0, 1, 2, 3, …)

Example 2: Solve cos x = -1/2:

To find the solutions of cos x = -1/2, we need to find the angles on the unit circle such that the x-coordinate of the point is -1/2. This occurs at the angles \frac{2 \pi}{3} and \frac{4 \pi}{3} (find these points on the unit circle!).

But once again, we also have a solution when we go around the circle a full revolution in either direction, i.e., if we add or subtract any integer multiple of 2 \pi to these two basic solutions. Hence, the solutions of cos x = -1/2 are

x =\frac{2 \pi}{3} \pm 2 \pi n, \ldots and x =\frac{4 \pi}{3} \pm 2 \pi n, \ldots (where n = 0, 1, 2, 3, …)

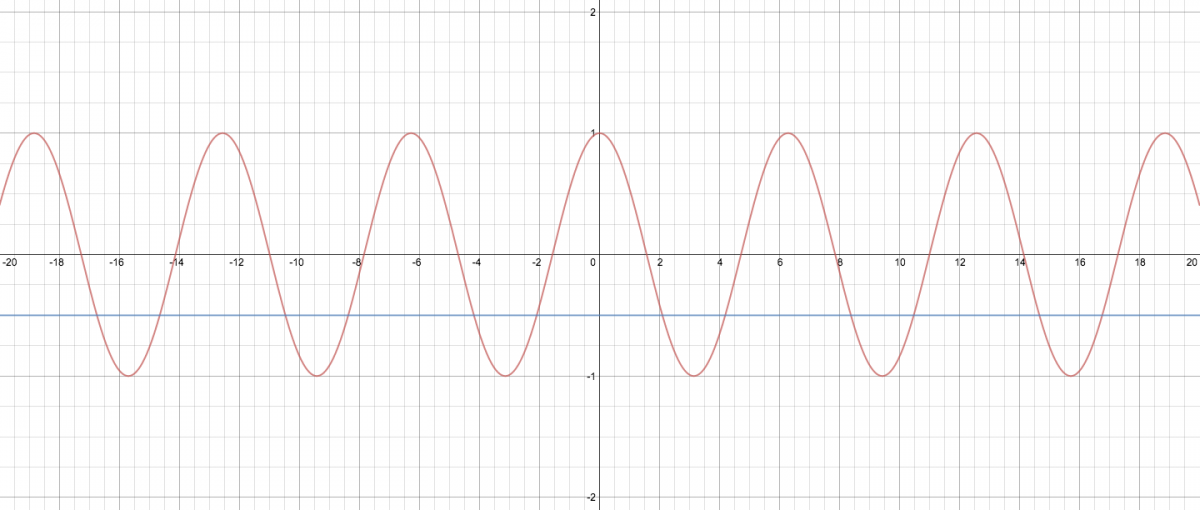
We can find this solution set by looking at where the graph of y = cos intersects with the line y = -1/2 (set up this graph in Desmos and look at the points of intersection–they will correspond exactly to the solution set given above):


cos-graph

Image: Unit Circle Labeled With Special Angles And Values

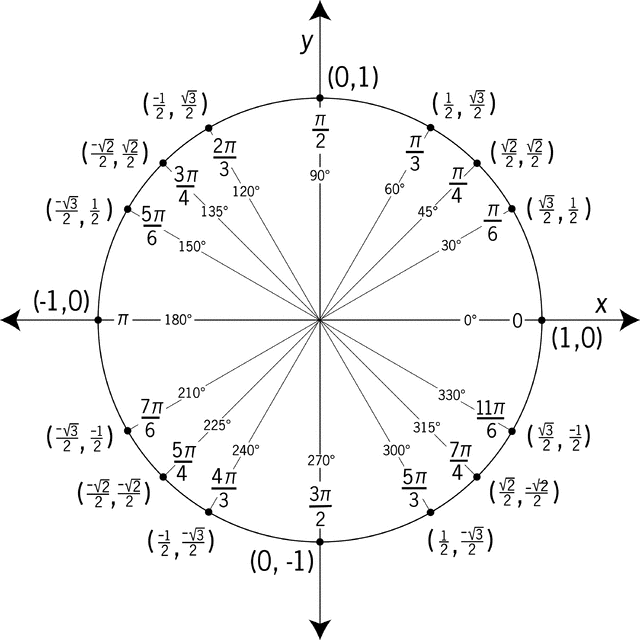
Here is a useful image of the unit circle labeled with the “special angles” and the coordinates of the corresponding points on the unit circle:

unit-circle-trig

(via http://etc.usf.edu/clipart/43200/43215/unit-circle7_43215.htm)

This image is useful since you can use it to find the sine and cosine of any of the given angles, using the definitions of sin t and cos t as the y- and x-coordinates, respectively, of the point on the unit circle corresponding to the angle t:

186px-Unit_circle.svg

Video: Properties of Logarithms

Here is a good video by PatrickJMT that reviews logarithms and their properties.  It covers:

  • the graph of a logarithmic function
  • the definition of logarithms, illustrated with some simple numerical examples (similar to exercise 13.4 on HW#8)
  • the properties of logarithms, and an example of using the properties to write a logarithmic expression in terms of elementary logarithms (similar to exercise 14. 2 and #2 on Quiz #3)
  • solving exponential equations using logarithms (similar to exercises 14.4 & 14.5)

GIF: Visualizing Sine and Cosine

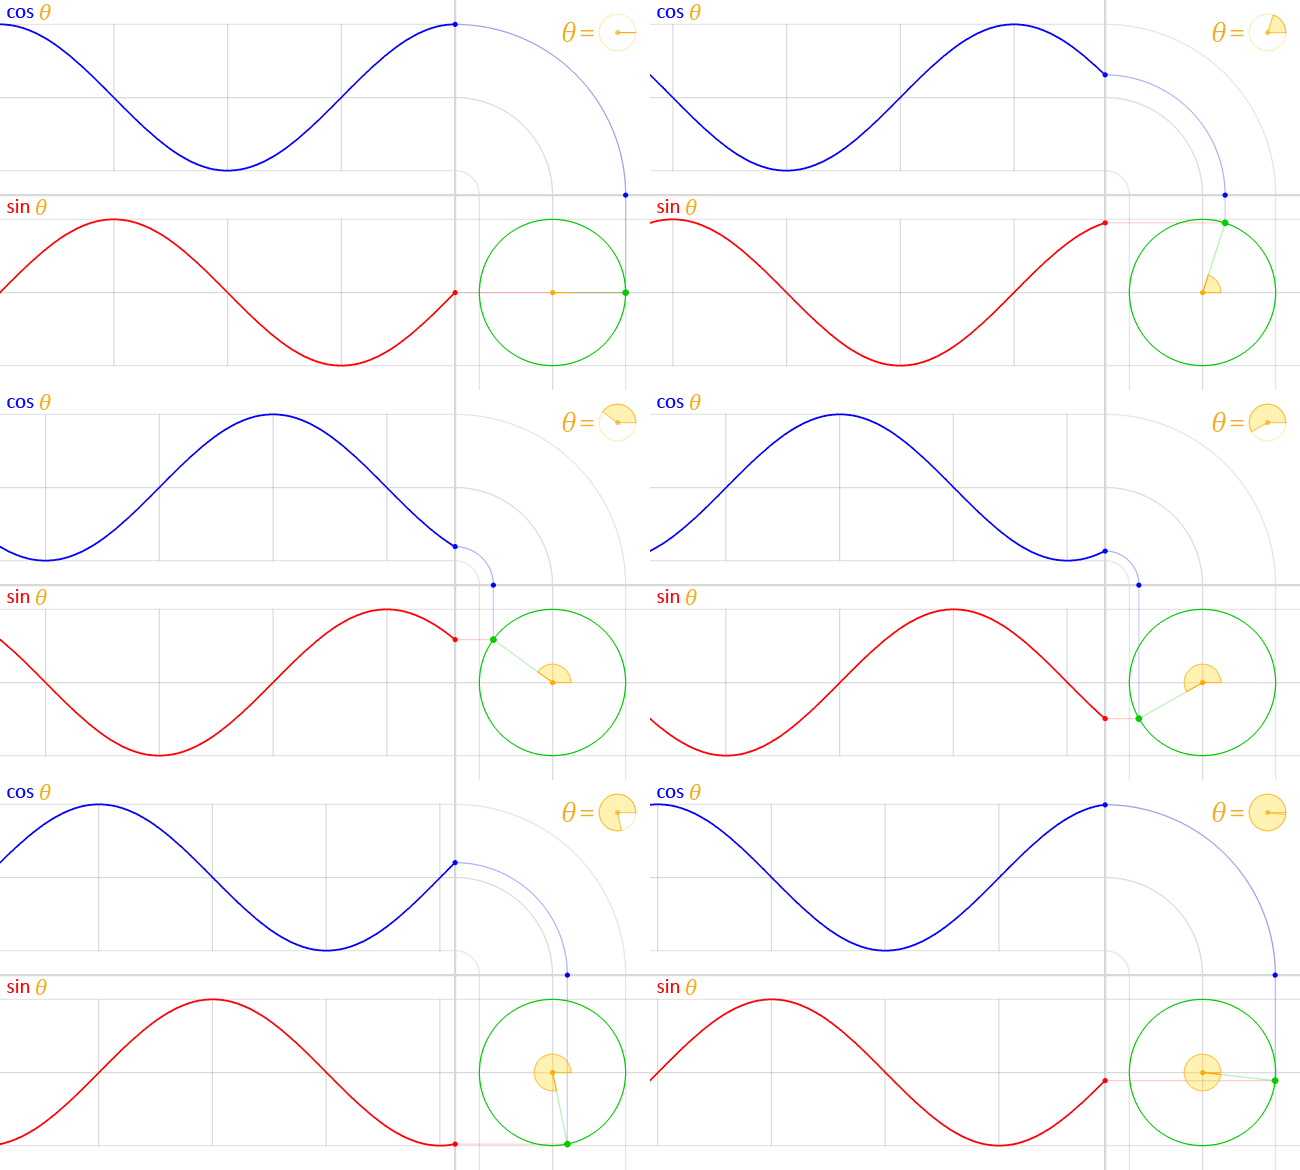
Below is a gif which may help you visualize the graphs of the sine and cosine functions in terms of their “unit circle definitions.”

First, here’s a reminder of the definitions of sine and cosine in terms of the unit circle: sin t is the y-coordinate of the corresponding point on the unit circle, and cos t is the x-coordinate (where t is the angle measured in radians).

186px-Unit_circle.svg

Now look at the graphs of the coordinates as the point rotates around the circle:

Circle_cos_sin

(By LucasVB (Own work) [Public domain], via Wikimedia Commons)

Here’s what’s going on: if you look at the unit circle part, the blue dot is at the x-coordinate of the point of the unit circle–and hence the blue graph is the graph of \cos \theta.

Similarly, the red dot is at the y-coordinate of the point of the unit circle, and hence the red graph is the graph of \sin \theta.

(Watch one full “period”–from when the angle \theta is at the 0 position until it goes all the way around the circle. You’ll the graphs trace out one full cycle of the sine and cosine waves (i.e., over the interval [ 0, 2 pi].


For an interactive version, click through on the image below for a Desmos graph:

On-Campus Math Tutoring

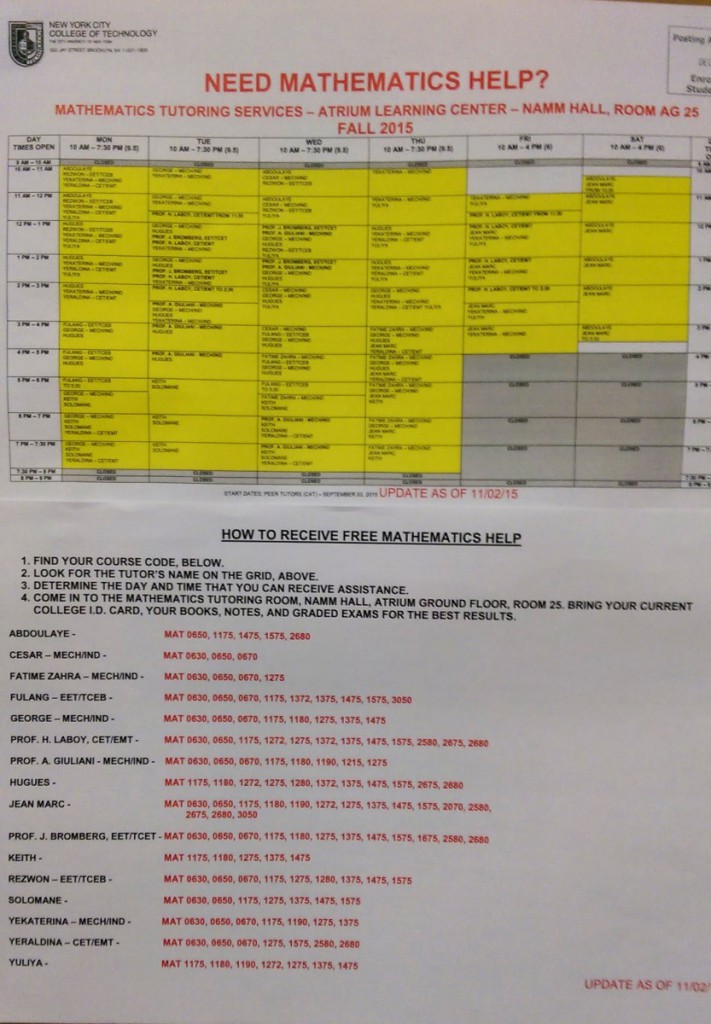
In addition to my office hours, there is a lot of free on-campus tutoring available to you:

  • The Atrium Learning Center has various math tutors available in AG-25 (on ground floor of the Atrium).
  • The Math Department also offers walk-in tutoring in M308 (in the Midway building, at 250 Jay St).

Both of these tutoring centers have math tutors available every day.  The schedules is shown below, and are also posted outside the Math Department office (N711).

Atrium Math Tutoring


math-tutoring

Key Features of Simple Rational Functions

We’re going to analyze simple rational functions, of the form:

  • constant in the numerator & linear term in the denominator (e.g. f(x) = 5/(x+2) )
  • linear term in the numerator & linear term in the denominator

Here’s how we can identify the following features of a rational function f(x) and its graph:

  • domain: solve for where the denominator equals 0 (exclude those points from the domain)
  • x-intercept(s): solve f(x) = 0 (in the case of a rational function, this means solving for where the numerator = 0)
  • y-intercept: calculate f(0)
  • vertical asymptote: for these simple rational function, the vertical asymptote occurs where the denominator equals 0 (so the same x-value that is not in the domain)
  • horizontal asymptote: depends on which type of rational function we’re looking at:
    1. If f(x) = constant/(linear term), then the horizontal asymptote is at y=0
    2. If f(x) = (linear term)/(linear term), then look at the ratio of the leading coefficients (i.e., the ration of the “x” coefficients)