Monthly Archives: November 2015

GIF: Visualizing Sine and Cosine

Below is a gif which may help you visualize the graphs of the sine and cosine functions in terms of their “unit circle definitions.”

First, here’s a reminder of the definitions of sine and cosine in terms of the unit circle: sin t is the y-coordinate of the corresponding point on the unit circle, and cos t is the x-coordinate (where t is the angle measured in radians).

186px-Unit_circle.svg

Now look at the graphs of the coordinates as the point rotates around the circle:

Circle_cos_sin

(By LucasVB (Own work) [Public domain], via Wikimedia Commons)

Here’s what’s going on: if you look at the unit circle part, the blue dotĀ is at the x-coordinate of the point of the unit circle–and hence the blue graph is the graph of \cos \theta.

Similarly, the redĀ dotĀ is at the y-coordinate of the point of the unit circle, and hence the redĀ graph is the graph of \sin \theta.

(Watch one full “period”–from when the angleĀ \theta is at the 0 position until it goes all the way around the circle. You’ll the graphs trace out one full cycle of the sine and cosine waves (i.e., over the interval [ 0, 2 pi].


For an interactive version, click through on the image below for a Desmos graph:
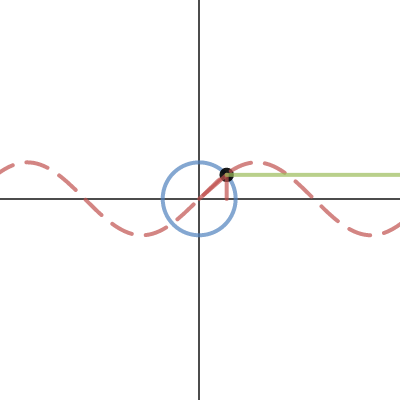
On-Campus Math Tutoring

In addition to my office hours, there is a lot of free on-campus tutoring available to you:

  • The Atrium Learning Center has various math tutors available in AG-25 (on ground floor of the Atrium).
  • The Math Department also offers walk-in tutoring in M308 (in the Midway building, at 250 Jay St).

Both of these tutoring centers have math tutors available every day.Ā  The schedules is shown below, and are also posted outside the Math Department office (N711).

Atrium Math Tutoring


math-tutoring

Key Features of Simple Rational Functions

We’re going to analyze simple rational functions, of the form:

  • constant in the numerator & linear term in the denominator (e.g. f(x) = 5/(x+2) )
  • linear term in the numerator & linear term in the denominator

Here’s how we canĀ identifyĀ the following features of a rationalĀ function f(x) and its graph:

  • domain: solve for where the denominator equals 0 (exclude those points from the domain)
  • x-intercept(s): solve f(x) = 0 (in the case of a rational function, this means solving for where the numerator = 0)
  • y-intercept: calculate f(0)
  • vertical asymptote: for these simple rational function, the vertical asymptote occurs where the denominator equals 0 (so the same x-valueĀ that is not inĀ the domain)
  • horizontal asymptote: depends on which type of rational function we’re looking at:
    1. If f(x) = constant/(linear term), then the horizontal asymptote is at y=0
    2. If f(x) = (linear term)/(linear term), then look at the ratio of the leading coefficients (i.e., the ration of the “x” coefficients)