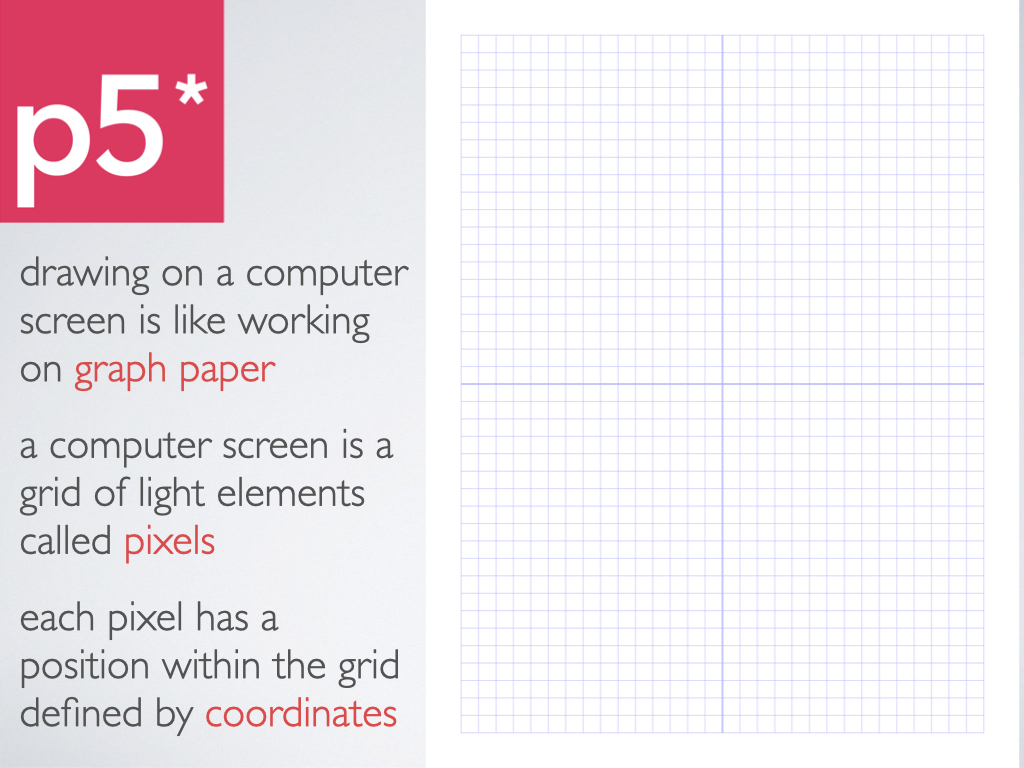
Because it originated as a tool for creative coding, it uses the metaphor of a drawing or painting canvas—
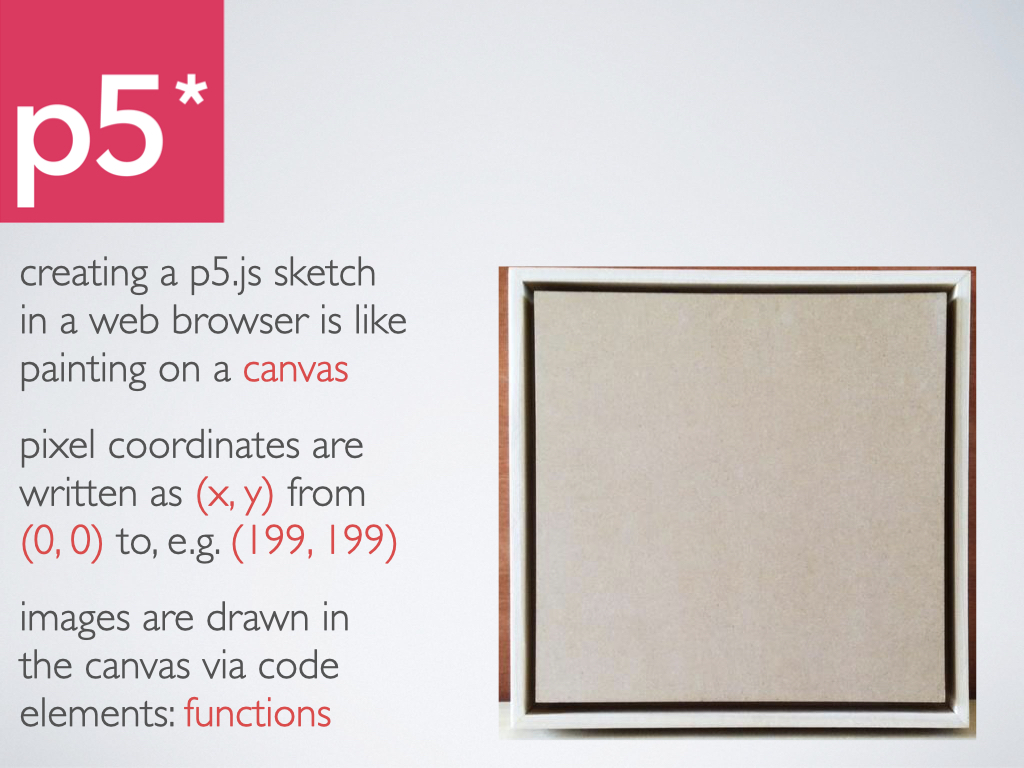
The default sketch in the web editor gives you two function coding blocks which do two different things—
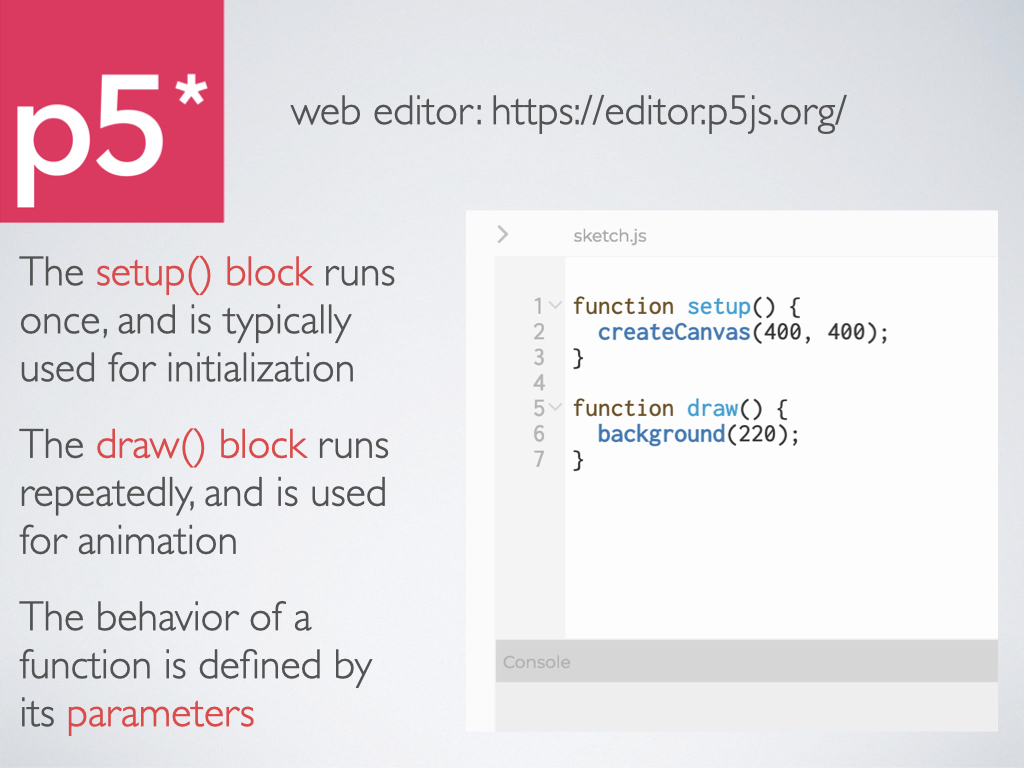
The function createCanvas() is written in a format that’s commonly known as “camel case” (because the first letter is lower case but the letter of the second word, which appears in the middle, is upper case) and the first number value is the width of the canvas, with the second number value being the height of the canvas.
The background() function assigns a greyscale value to the background if you use just one number. Black is “0” and white is “255.”
The most basic drawing function is a point(x,y), with the x coordinate being a pixel number that counts from left to right and the y coordinate being a pixel number that counts from top to bottom. In the example below, why don’t you see the point?—
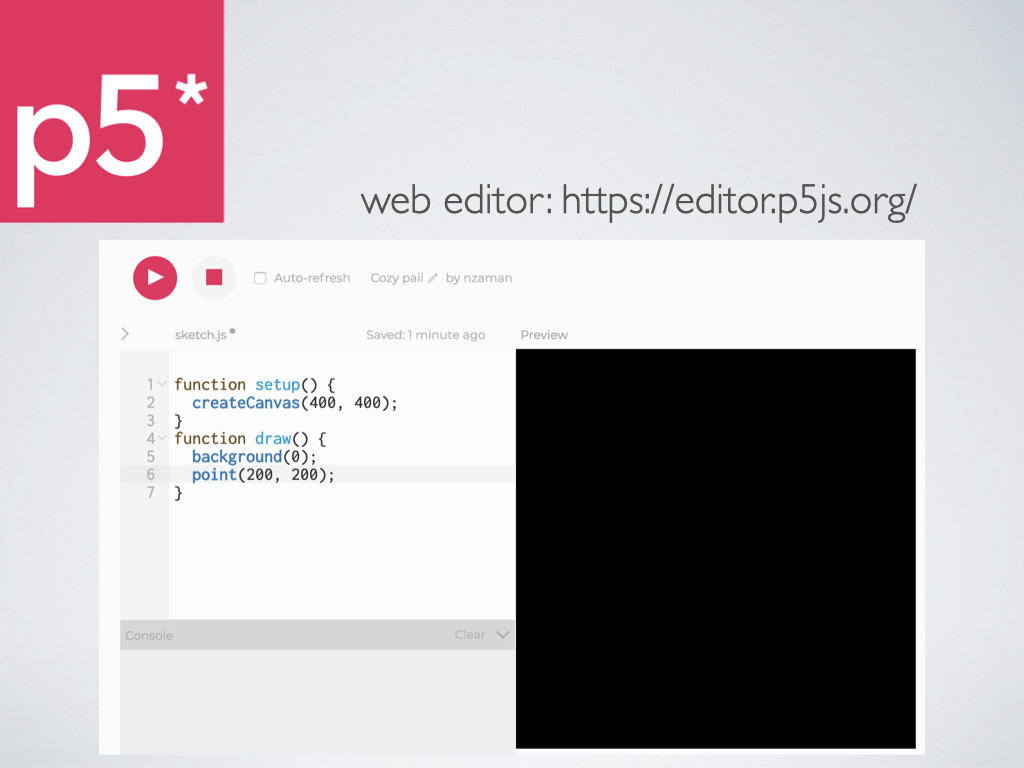
To see a point more easily, add the function called stroke(), which will give it a greyscale value with just one parameter (a number between 0-255), and also a thickness using the function called strokeWeight()—
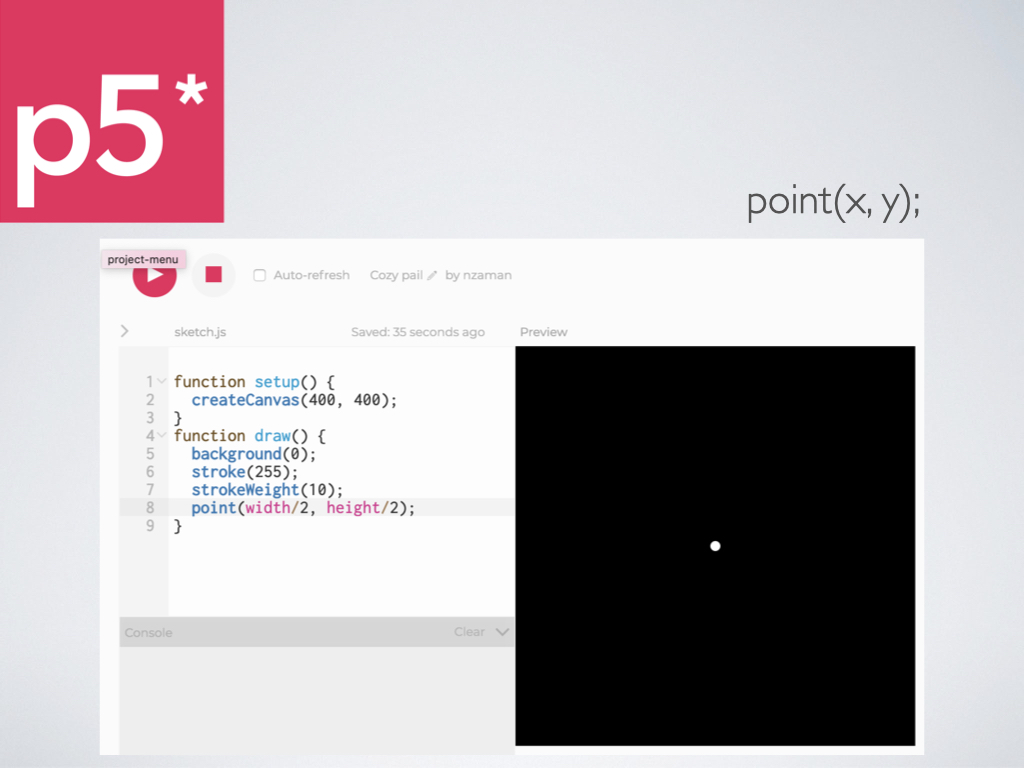
You’ll see that you can also orient a point (or any object) within a canvas by using the built-in system variables (colored pink above) of width, which is a stand-in for the first number in createCanvas, and height, which is a stand-in for the second number in createCanvas. One reason to do this is to ensure that your point is in the middle of the canvas and will stay in the middle if you decide to change the size of your canvas.
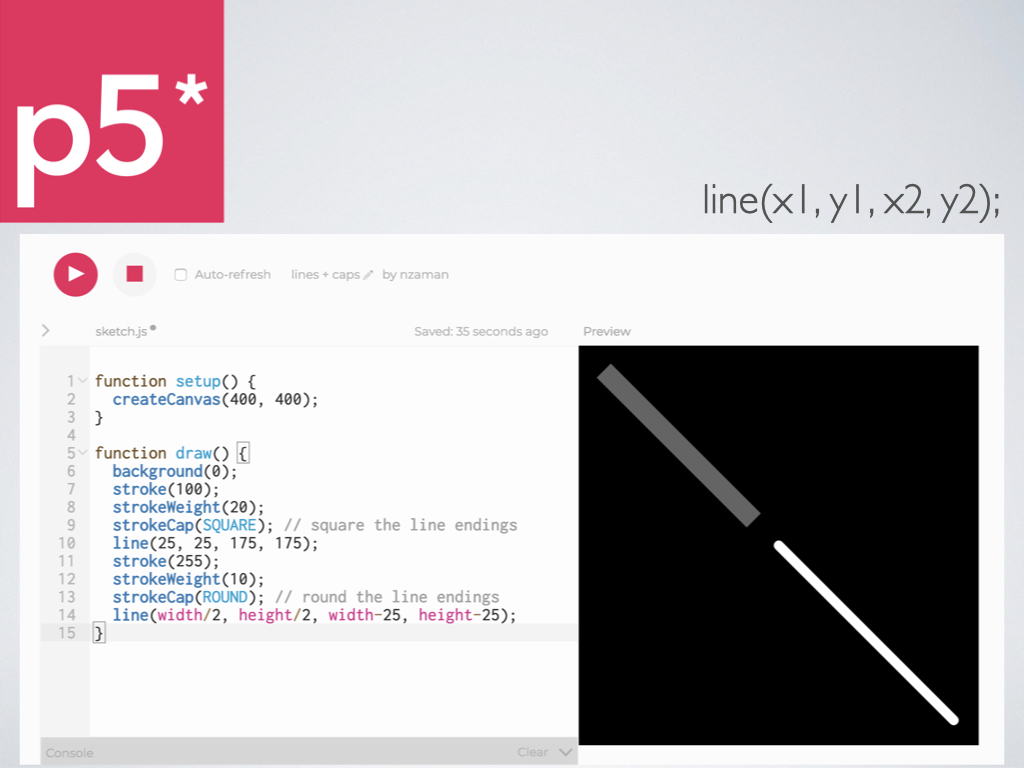
A line is created by specifying two different point coordinates: x1, y1 and x2, y2. You can apply different greyscale values and thicknesses to different lines, but remember that these attributes must come before you draw the lines. When you have a thickness applied via the strokeWeight() function, you can change how the ends appear with the strokeCap() function, which takes a word in ALL CAPS as a parameter—
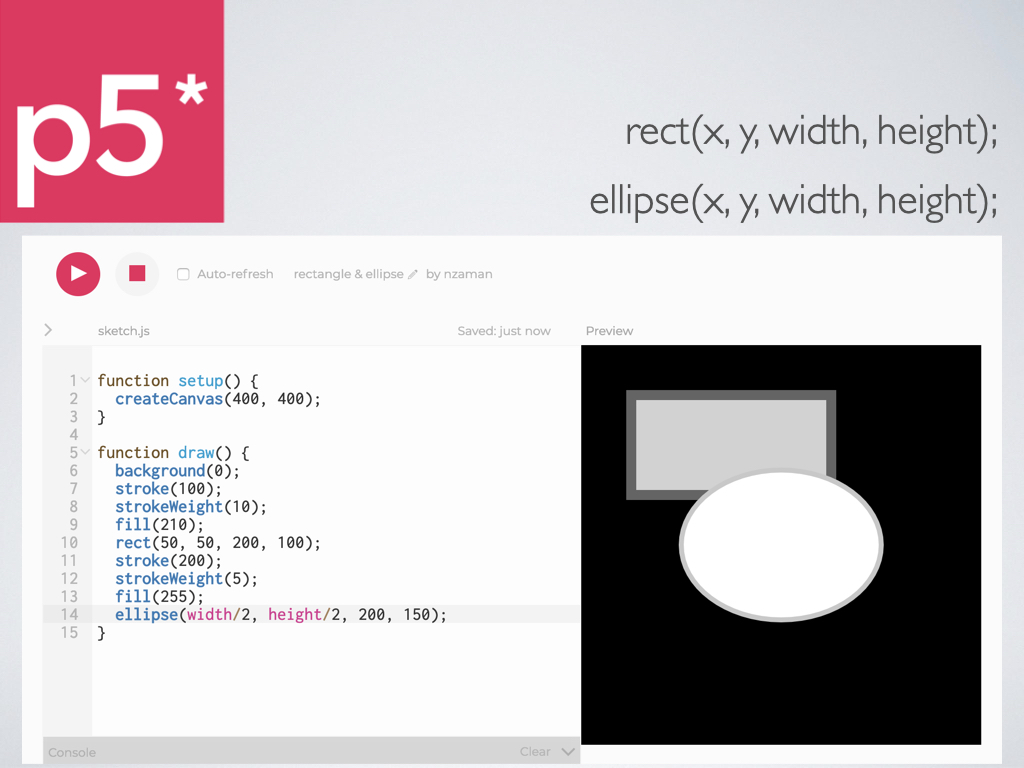
The functions that make rectangles and ellipses have the same parameters: an x, y coordinate as a starting point, followed by its width and height. However a rectangle’s x and y point is the upper left corner, and an ellipse’s x and y point is in the center.
Similar to the stroke() function for points and lines, the fill() function is used for filling in the greyscale of a shape that has an area, e.g. a width and height.
You can apply different outlines to the shapes using the stroke() and strokeWeight() functions. You can create the illusion of one object being in front or in back of another. Why does the ellipse appear in front of the rectangle?—
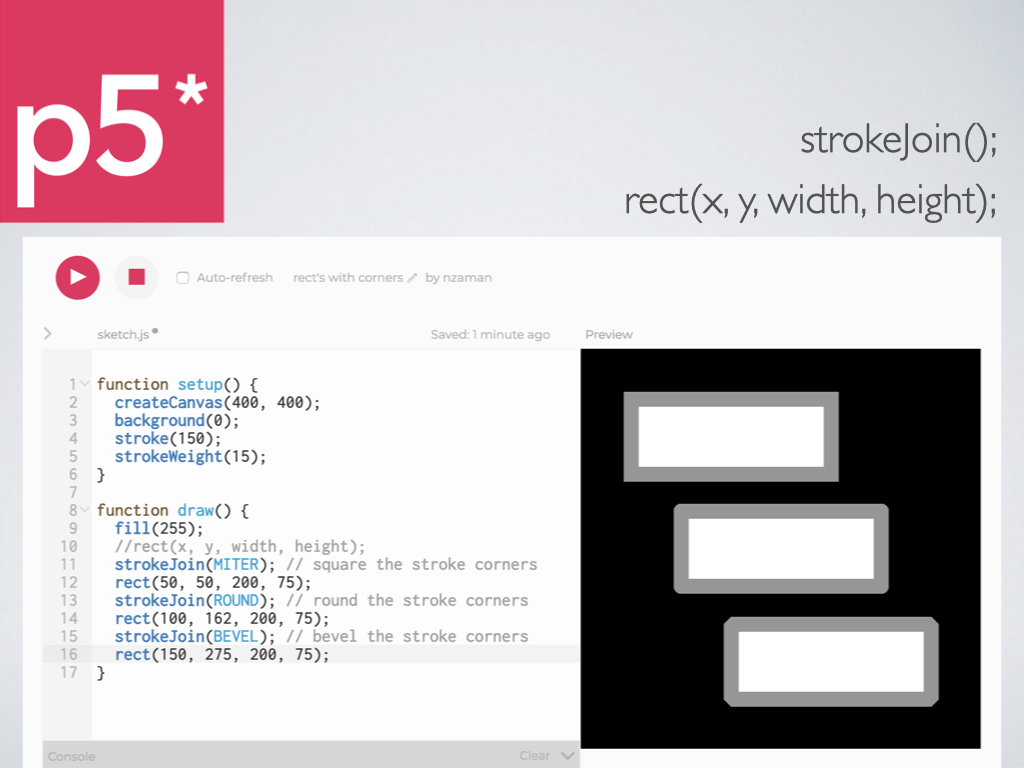
If you want your objects to all have the same greyscale value and thickness, you can put the stroke() and strokeWeight() functions inside of the setup block. Similar to changing the appearance of the ends of a line, you can make the edges of a rectangle appear different using the strokeJoin() function—
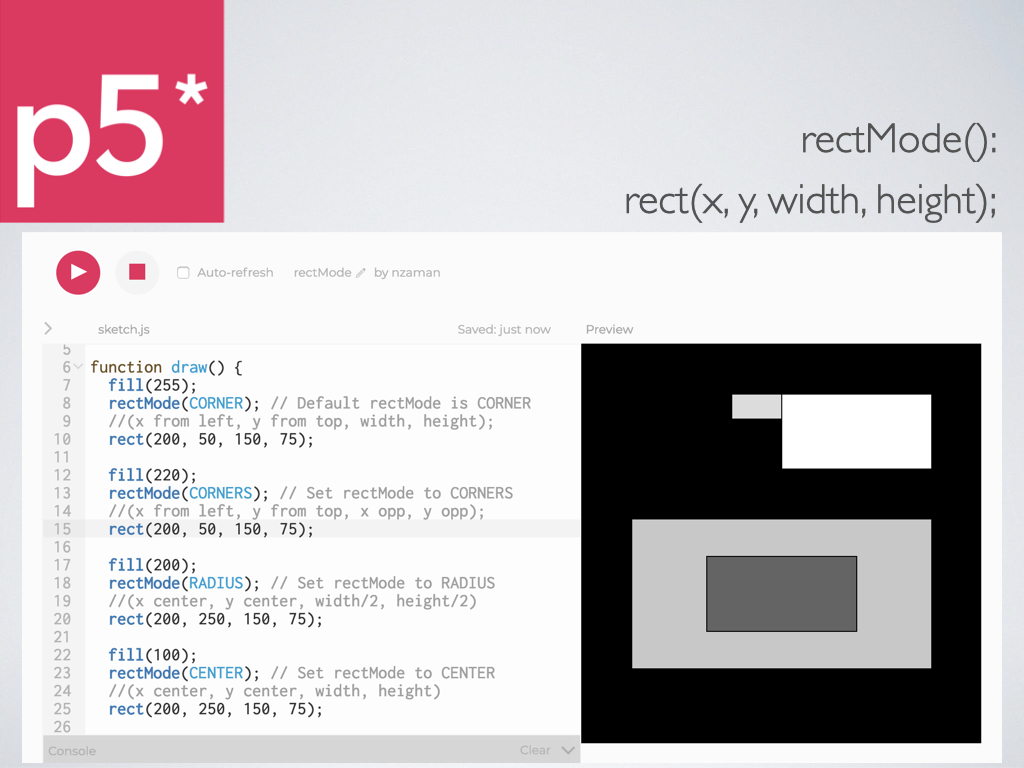
If you don’t specify a stroke value or thickness, you’ll see that the default greyscale is black, which is the number 0, and the default thickness is 1 pixel. If you want to change the origin of the x, y point that your rectangle is drawn from, you can use the rectMode() function—
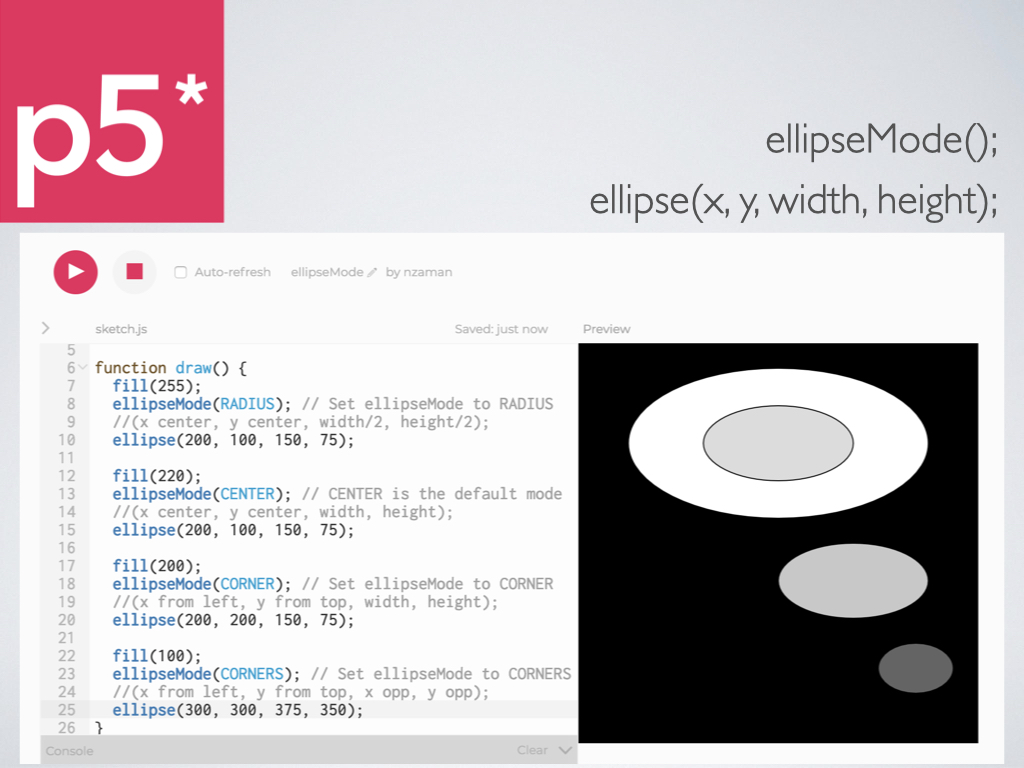
If you want to change the origin of the x, y point that your ellipse is drawn from, you can use the ellipseMode() function—
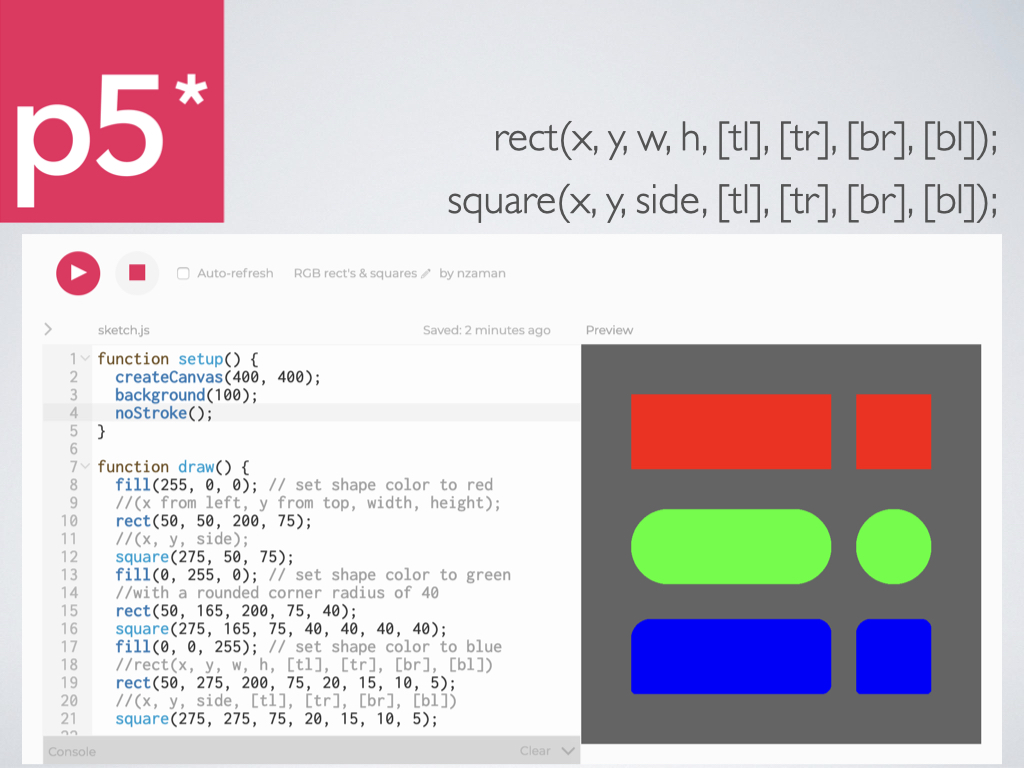
The example below shows several things.
• In the setup(){} block, you’ll see a new function called noStroke() that specifies that none of the objects in the draw(){} block will have an outline.
• You also now see colors instead of greyscale values, which is achieved by using 3 numbers instead of 1 inside the fill() function. The first is the red value, the second is the green value, and the third is the blue value. This is referred to as “RGB” (not to be confused with RBG, Ruth Bader Ginsburg).
• If you know that you want a square, you can simply use the square() function which has only 3 parameters inside of 4: (x, y, side), with side being both the width and the height.
• You can change the roundness of the corners for both rectangles and squares by accessing the optional parameters. Optional parameters are noted by square brackets: [ and ]. In this case, tl = top left, tr = top right, br = bottom right, and bl = bottom left. Each one takes a number for the corner radius—
This is what we got through today, much of what will be on Monday’s quiz. See the Shape section within the p5.js Reference for more information, and also make sure to read through the first two chapters of the book PDF. Ultimately, our goal is to cover the first five chapters—

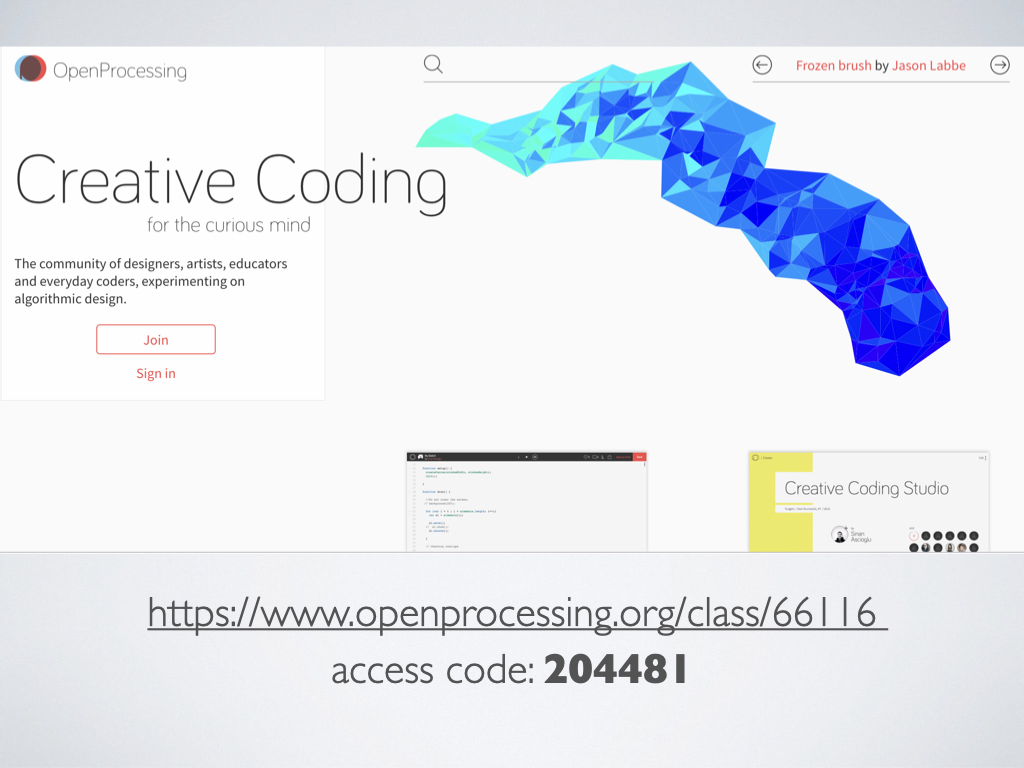
We’ll be using the online editor in OpenProcessing because of the Classes feature, so if you didn’t already create a free login and sign into the class, please do it as soon as possible—
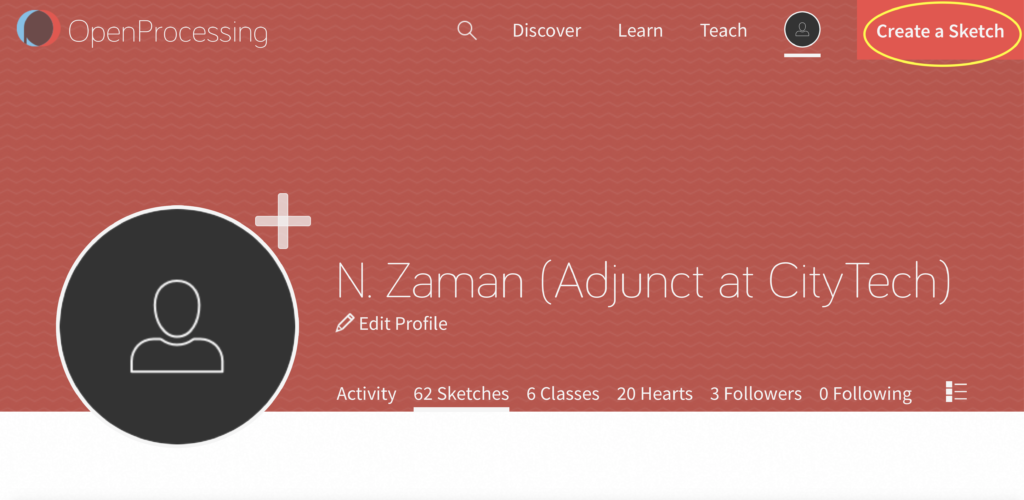
The first step is to create a sketch by clicking on the button on the upper right—
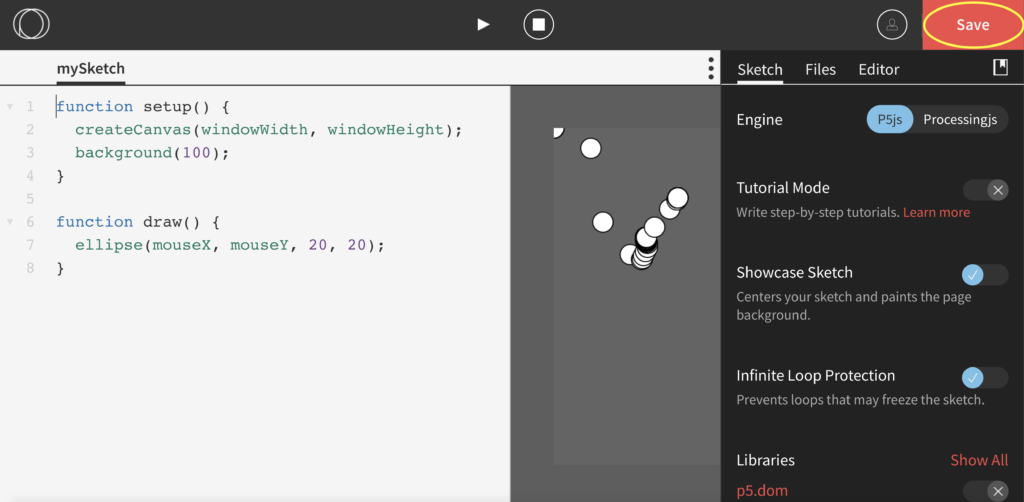
Then immediately save it by clicking on the button on the upper right—
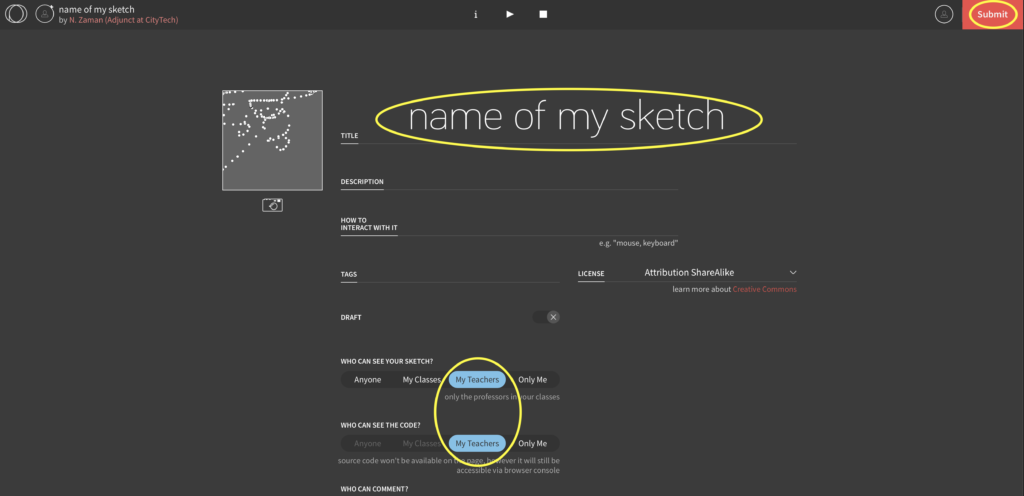
Give it a unique name (and ideally also a description), set the sketch visibility to My Teachers, and click on the submit button to save the info, which you can always access by the “i” icon on the top—
To see the split screen view, with the code on the left, and the sketch on the right, click on the 3 black dots to open up the side panel, then the Editor tab, and then the split screen icon under Layout—
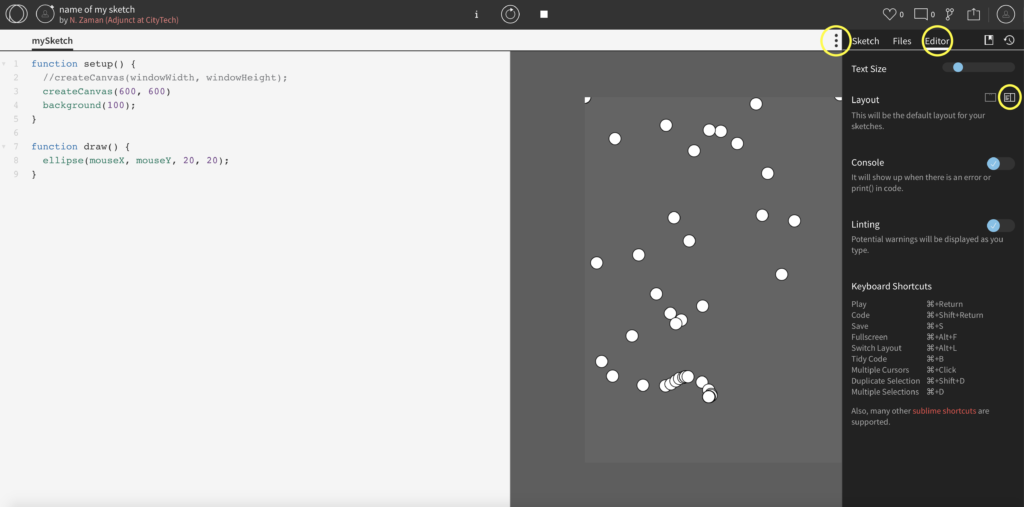
In the screenshot above, you’ll see that I “commented out” the default createCanvas() line because I want you to use number values for the width and height of the canvas.
Reference the examples posted in Section 01 of the OpenProcessing class site as you prepare for the next class and start working on Assignment 6.
Print this page


Leave a Reply