VARIABLES
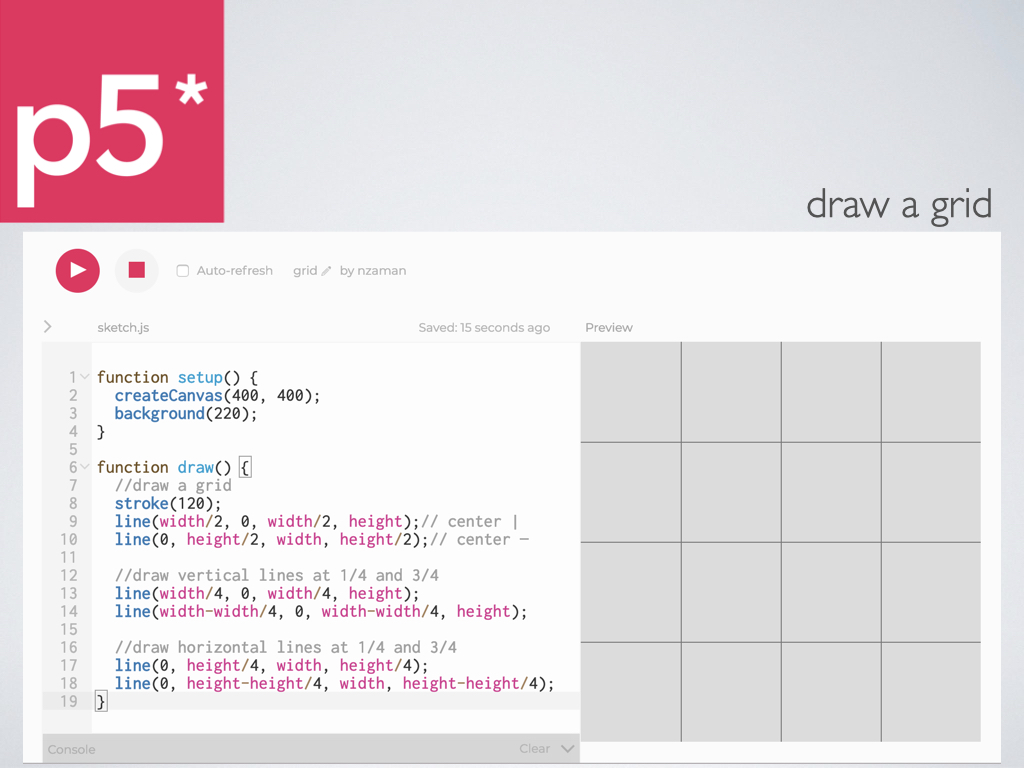
After you’ve input numbers, or parameters, within createCanvas() for the width and height of your drawing space, you can reference them within the draw() function block using the built-in variables of width and height. This allows you to just change those numbers in one place and have everything you draw automatically adjust their location relative to the canvas size. Here’s the grid image again that you can create as a drawing guide:
You can create your own variables by using var followed by whatever you want you to call them. It’s smart to name your variables according to how you’ll use them (e.g. x for the x coordinate, w for the width). You’ll use the = operator to assign a value to a variable and then you can use other other operators within the function blocks to define mathematical relationships with the variables.
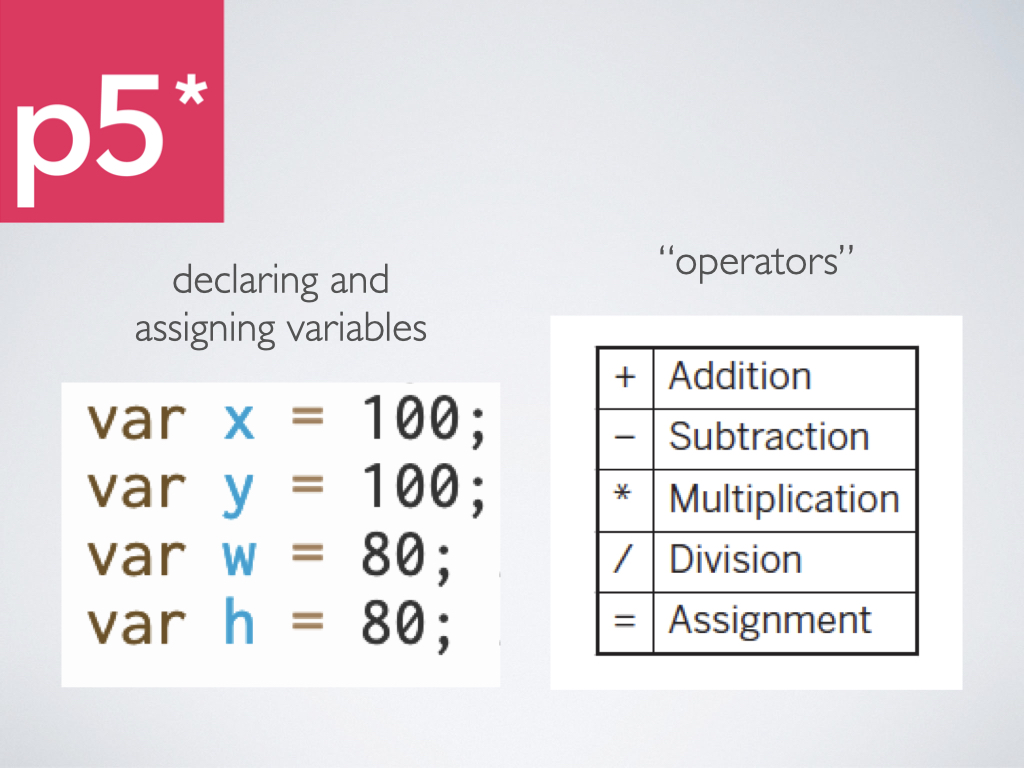
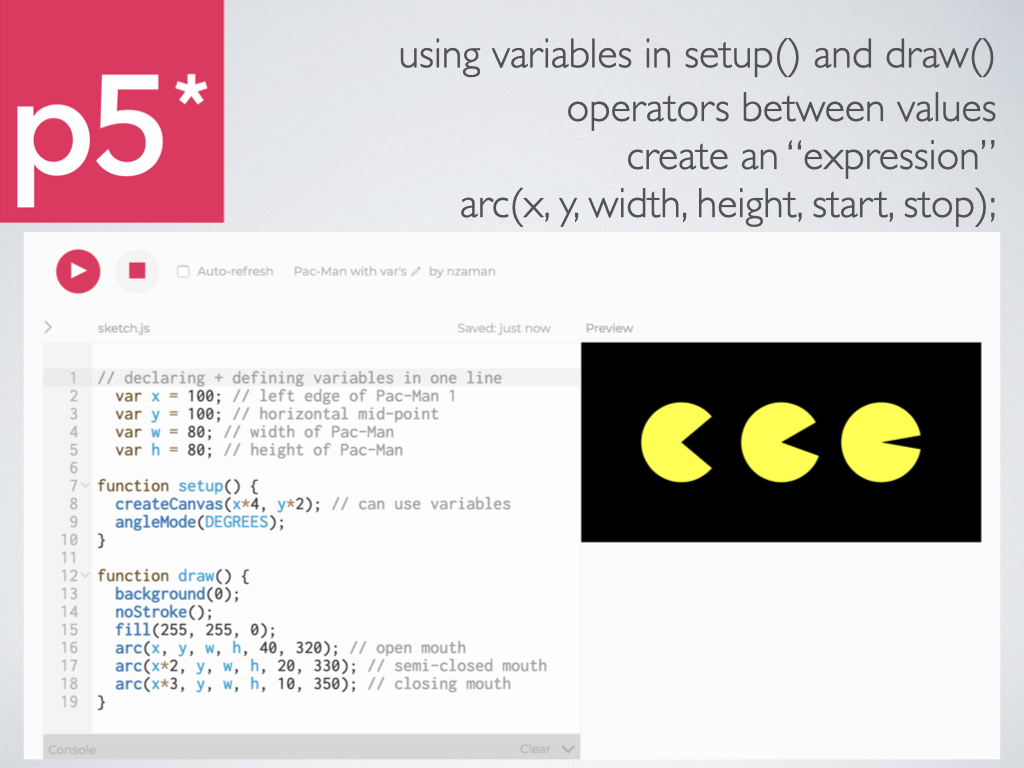
You can declare and assign variables in one step, and when you do that above the setup() and draw() blocks, it’s called a global variable. This allows you to use those variables inside any function block, along with operators. See this updated example on OpenProcessing.
PEMDAS is an acronym for the priority of operators, as listed below. It’s safest to use parenthesis around each operation though.
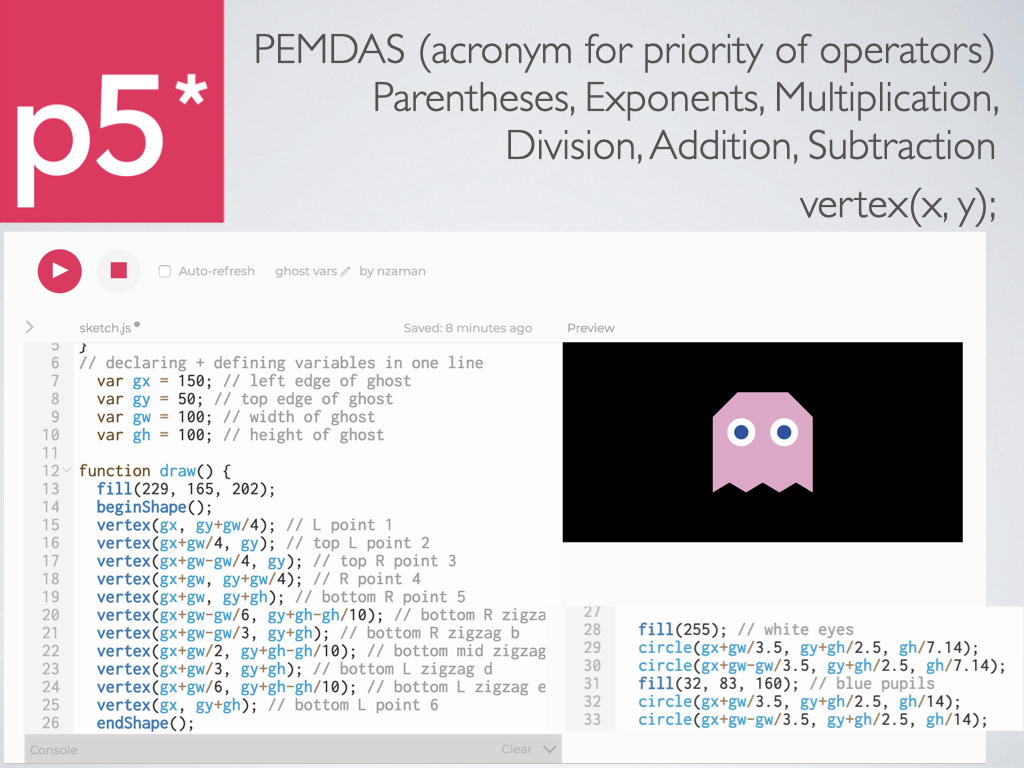
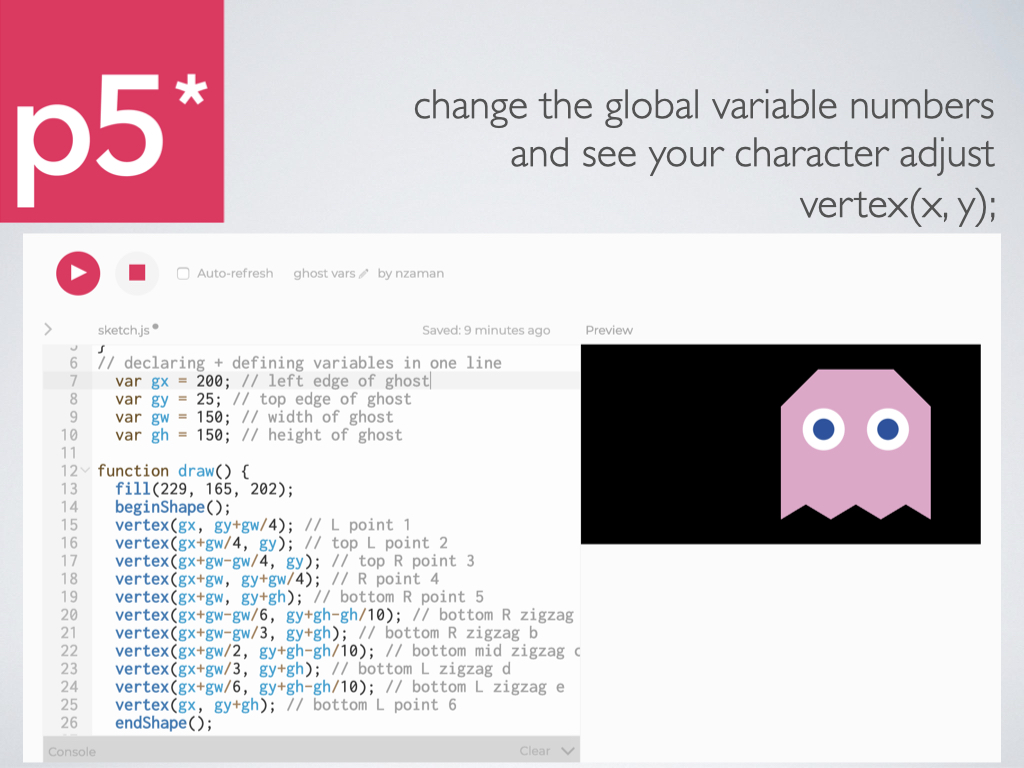
You can translate a static character that you drew with vertex coordinates, for example, to one that has variable dependency. Figure out reference points that you’ll assign to the variables and note them using comments. Then calculate the other coordinates in relation to the variables. This allows you to later add interaction (see the Response section below) that will move the entire character.
RESPONSES
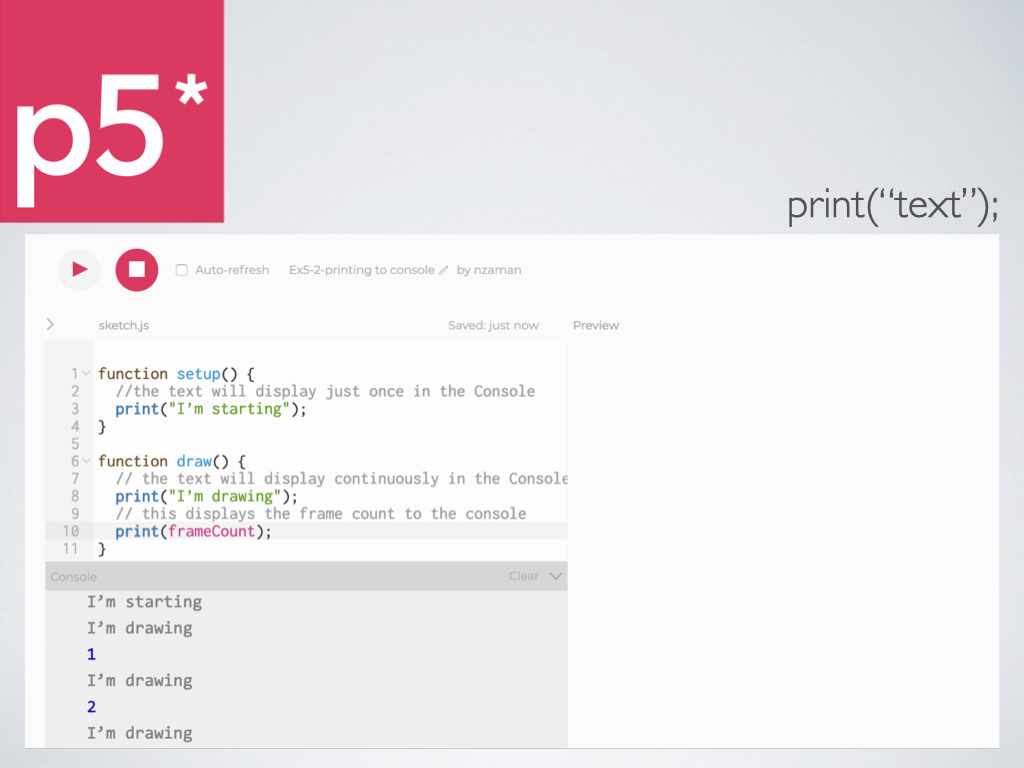
To illustrate within the Console how the setup() and draw() blocks work, use print() with whatever text you want as the parameter within double quotes. Setup() runs only once and will thus print just one line. Using the built-in frameCount variable within draw() illustrates how it runs as a loop. See this sketch.
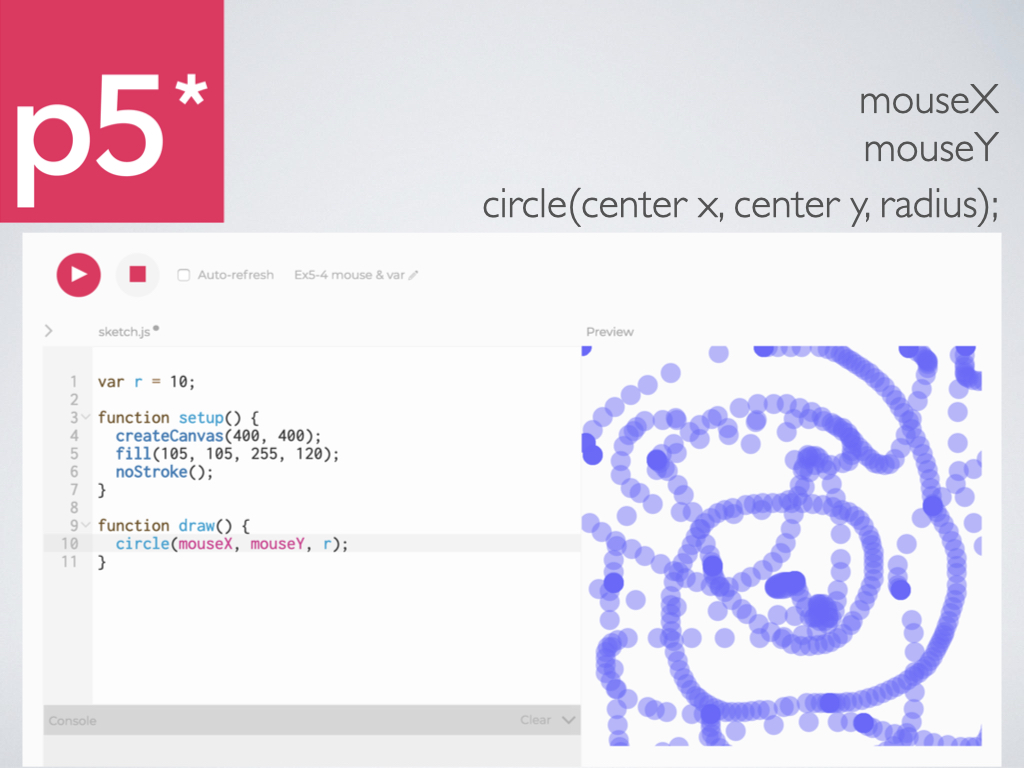
In place of any x coordinate parameter, you can use the built-in variable mouseX, and similarly, in place of any y coordinate parameter, you can use the built-in variable mouseY. Note the camelCase! See this sketch.
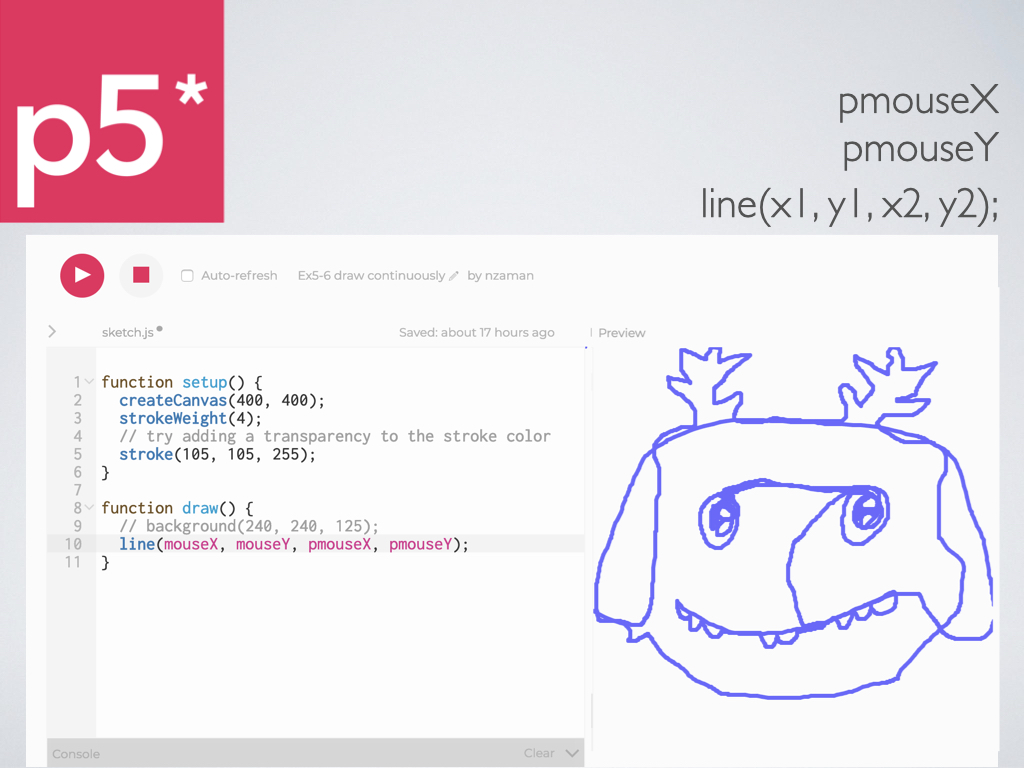
The pmouseX and pmouseY variables store the position of the mouse that was at the previous frame. Like mouseX and mouseY, these special variables are updated each time draw() runs through the loop. If you use these as the parameters of line() as shown below, you can create the illusion of a continuous line by connecting the current and most recent location. See this sketch.
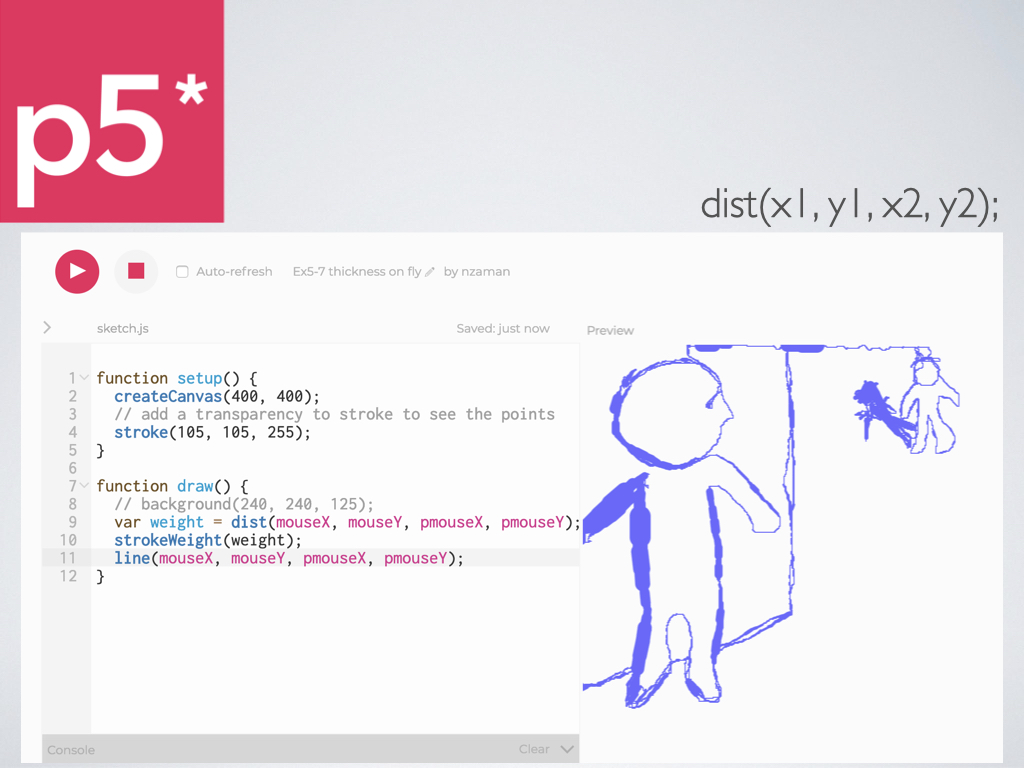
A function called dist() can be used to calculate the difference between any two pairs of x and y points, or in this case, the current and most recent mouse location. You can then declare and assign a variable to store that difference value — in this example, it’s being used as the parameter within strokeWeight(). The faster you move the mouse, the higher the value of the difference, and therefore the thicker the outline. See this sketch.
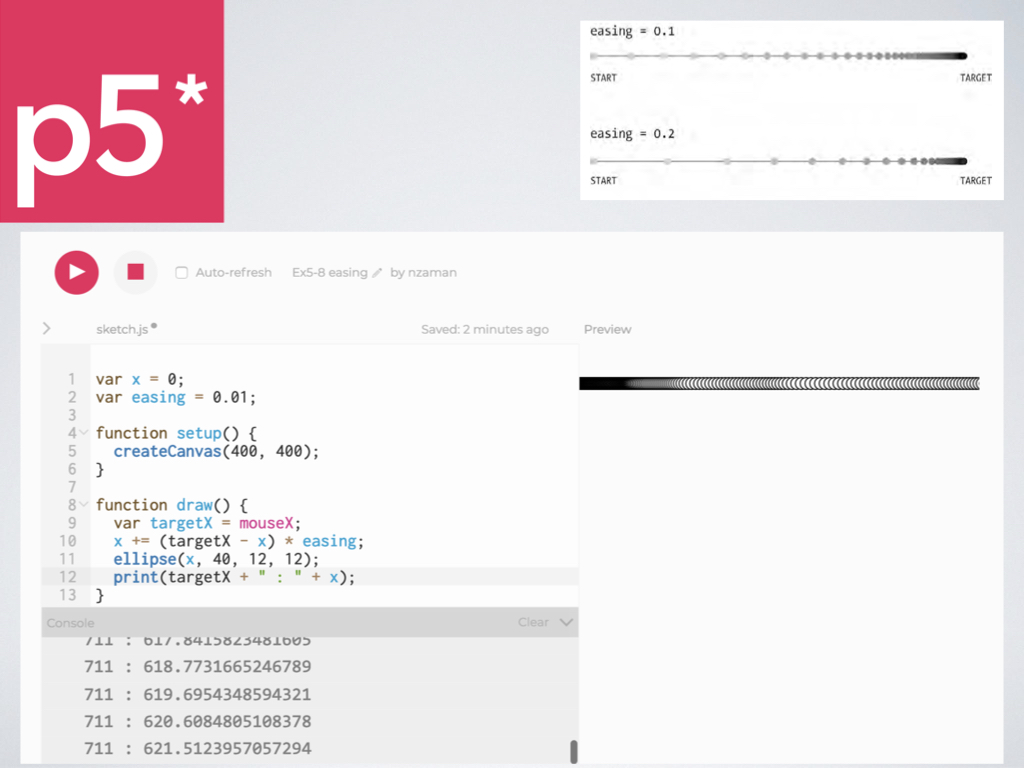
You may want to create the effect of a lag, or a more fluid motion, using a technique called easing. With easing, there are two values: the current value (e.g., x) and the value to move toward (e.g., targetX, which in the example below, is set to mouseX). In the calculation line 10 below (by the way, “x += [whatever]” is a shorthand way of writing “x = x + [whatever]”), the difference between the target (mouseX) and current value is calculated, then multiplied by the easing variable (a number between 0 and 1), and then added to x to bring it closer to the target with each iteration through the draw loop. You can use the print() function to display the actual values in the Console.
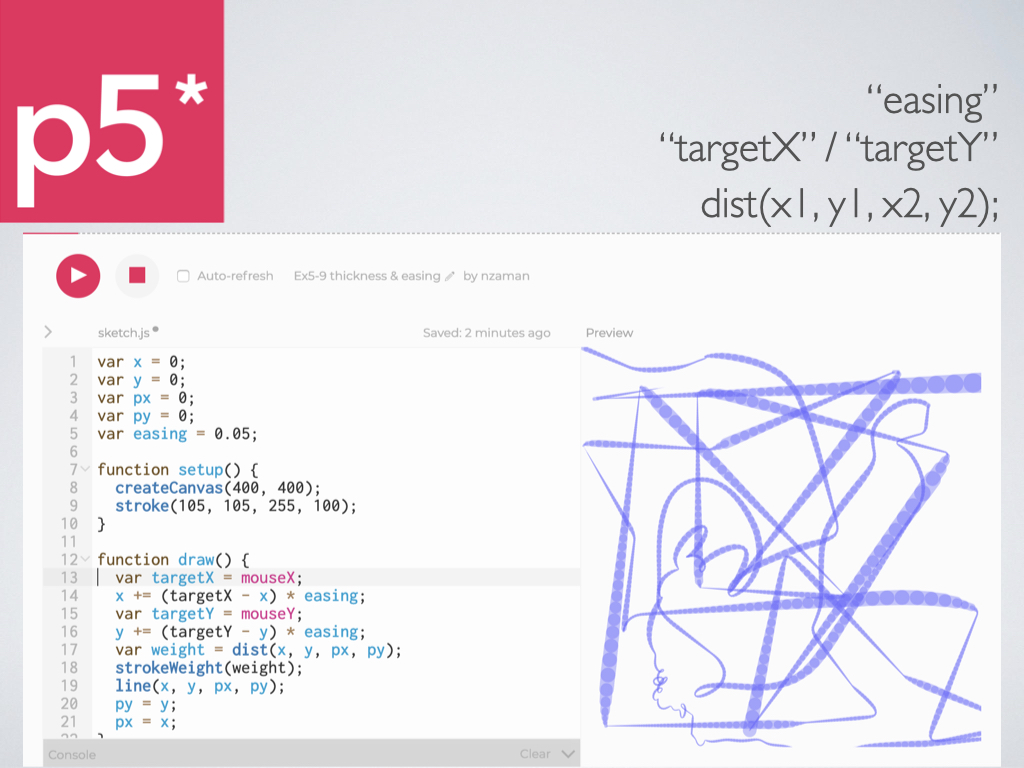
See this sketch, which adds a calculation for the y coordinate so that the easing formula can be applied to the continuous line example.
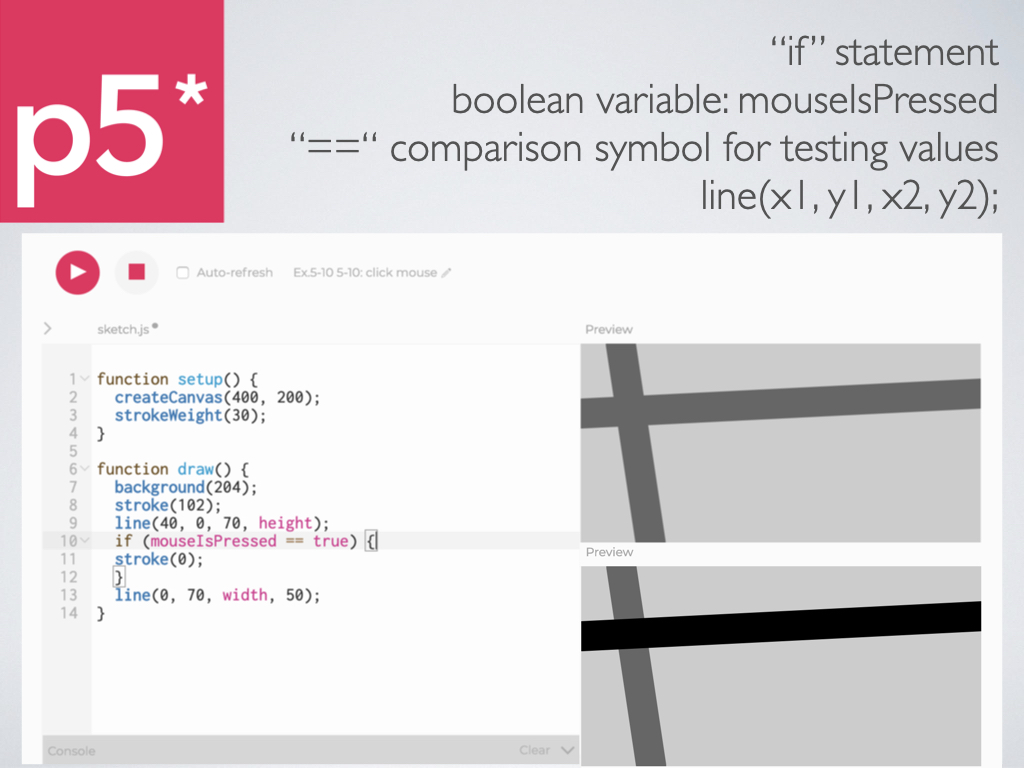
The mouseIsPressed variable is a boolean variable, which means it has only two possible values: true or false. The == symbol is a comparison symbol, versus an operator (which you saw earlier), and tests whether the things on either side are equivalent. Used within an if()statement, when you press or click the mouse, whatever you put inside the block will execute — in this case, changing the stroke() parameter. The default value of mouseIsPressed is true, so you can more simply write: if (mouseIsPressed){[do this]}. See this example variation. The keyIsPressed boolean variable functions the same way, except it’s activated when any key is pressed (instead of the mouse).
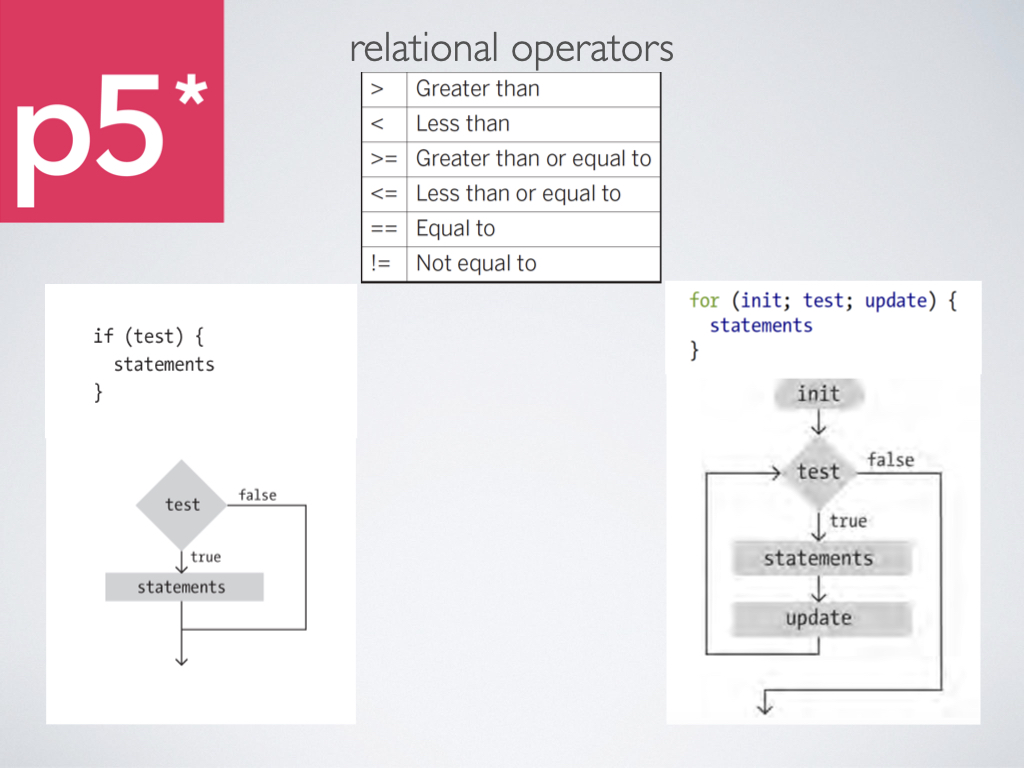
On the left below is the diagram from the book (Fig 5.2) which illustrates the flow for an if() statement block.
On the right is a similar type of flow for what is commonly called a for() loop. Like the draw() block, it’s a block that loops according to the parameters you define. On the top, you’ll see the various relational operators that you can use within the (). Notice the use of the semi-colon to separate the parts: (init; test; update). The init typically declares a new variable and assigns a value, which is the starting point, for example i=0. The test is a relational expression that compares two values with a relational operator, for example telling the for() loop to keep running as long as the variable is less than a number, i<400. The update determines how the variable changes while the for() loop is running, for example, i +=10 (which means the value of i will increase by 10 until it hits 400, so 10, 20, 30…390).
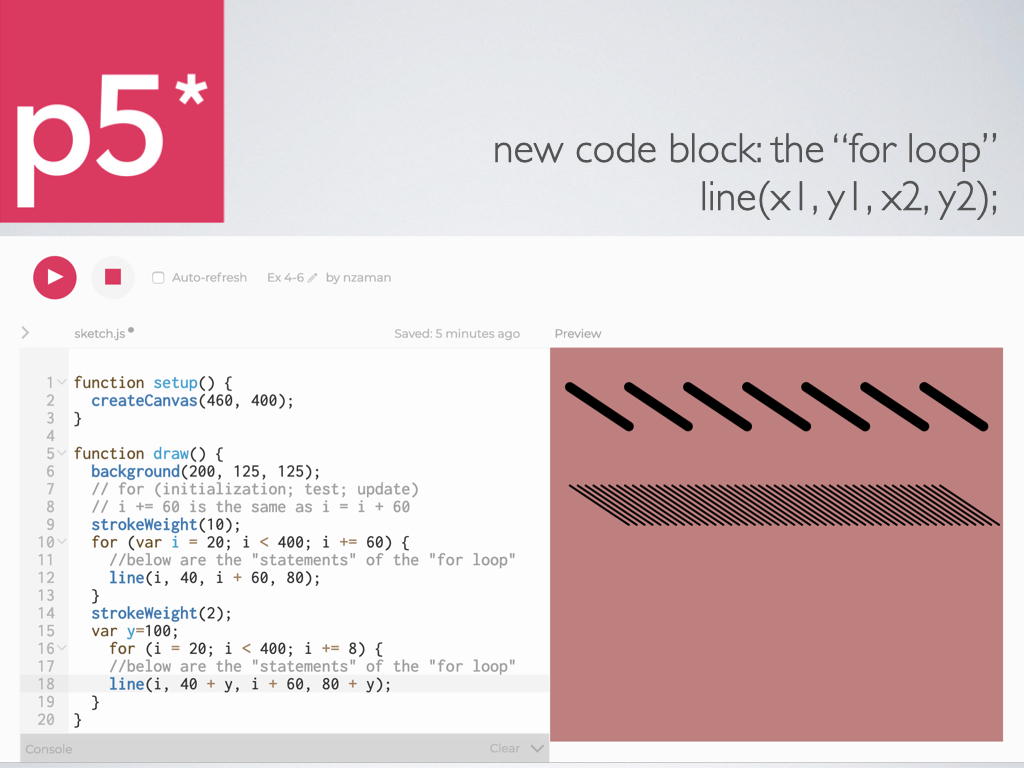
One smart way to use a for() loop is to avoid drawing repeating elements. In the example below, two sets of diagonal lines are drawn — the thicker ones are drawn every 60 pixels along the horizontal x axis, starting at x1=20 through x1 =340 (400-60). The set of lines below that is drawn every 8 pixels, so you have many more as a result. See this sketch.
Building on the snowman example, here’s the second tutorial video, which shows you how to replace coordinate values with variables so that you can make something move (in this case, the branch arms) with a mouse-click: https://vimeo.com/399768213/4e191a312a and here’s the third tutorial video, which shows you how to draw a repeating shape (in this case, the buttons) with a for() loop: https://vimeo.com/399768589/a466b443d0. You can see the resulting sketch here: https://www.openprocessing.org/sketch/860977.
With your own Assignment 7 sketch, make sure to either “Save as a Fork” if you’re building on your Assignment 6 sketch, or Create a Sketch to make a new drawing. Make sure to customize your drawing and add comments demonstrating your understanding of how you’re using variables and coding interactions. Sketches are graded not only on how well they meet the requirements, but also on the aesthetics of your sketch and coding efficiency and alignment.
Remember that you can select multiple lines of code and then hit the command + “/” key (on a Mac, for example) to “comment out” all lines at once (and you can re-activate those lines of code by doing the same thing). Similarly, for ensuring that your code is properly aligned with the setup() and draw() blocks, and within any if() or for() blocks, you can select multiple lines of code and hit the command + “]” to indent the lines (move them all one step to the right), or command + “[“ to move the lines to the left.
Print this page


Leave a Reply