Contents
- 1 Thinking like a Psychological Scientist
- 2 Introduction
- 3 Scientific Versus Everyday Reasoning
- 4 The Interpretation of Research Results
- 5 Why Should I Trust Science If It Can’t Prove Anything?
- 6 Scientific Theories
- 7 Is Science Objective?
- 8 Science in Context
- 9 Research Designs
- 10 Research Designs
- 11 Experimental Research
- 12 Correlational Designs
- 13 Qualitative Designs
- 14 Quasi-Experimental Designs
- 15 Longitudinal Studies
- 16 Surveys
- 17 Tradeoffs in Research
- 18 Research Methods: Why You Need Them
Thinking like a Psychological Scientist
California Baptist University
We are bombarded every day with claims about how the world works, claims that have a direct impact on how we think about and solve problems in society and our personal lives. This module explores important considerations for evaluating the trustworthiness of such claims by contrasting between scientific thinking and everyday observations (also known as “anecdotal evidence”).
Learning Objectives
- Compare and contrast conclusions based on scientific and everyday inductive reasoning.
- Understand why scientific conclusions and theories are trustworthy, even if they are not able to be proven.
- Articulate what it means to think like a psychological scientist, considering qualities of good scientific explanations and theories.
- Discuss science as a social activity, comparing and contrasting facts and values.
Introduction
Why are some people so much happier than others? Is it harmful for children to have imaginary companions? How might students study more effectively?

Even if you’ve never considered these questions before, you probably have some guesses about their answers. Maybe you think getting rich or falling in love leads to happiness. Perhaps you view imaginary friends as expressions of a dangerous lack of realism. What’s more, if you were to ask your friends, they would probably also have opinions about these questions—opinions that may even differ from your own.
A quick internet search would yield even more answers. We live in the “Information Age,” with people having access to more explanations and answers than at any other time in history. But, although the quantity of information is continually increasing, it’s always good practice to consider the quality of what you read or watch: Not all information is equally trustworthy. The trustworthiness of information is especially important in an era when “fake news,” urban myths, misleading “click-bait,” and conspiracy theories compete for our attention alongside well-informed conclusions grounded in evidence. Determining what information is well-informed is a crucial concern and a central task of science. Science is a way of using observable data to help explain and understand the world around us in a trustworthy way.
In this module, you will learn about scientific thinking. You will come to understand how scientific research informs our knowledge and helps us create theories. You will also come to appreciate how scientific reasoning is different from the types of reasoning people often use to form personal opinions.
Scientific Versus Everyday Reasoning
Each day, people offer statements as if they are facts, such as, “It looks like rain today,” or, “Dogs are very loyal.” These conclusions represent hypotheses about the world: best guesses as to how the world works. Scientists also draw conclusions, claiming things like, “There is an 80% chance of rain today,” or, “Dogs tend to protect their human companions.” You’ll notice that the two examples of scientific claims use less certain language and are more likely to be associated with probabilities. Understanding the similarities and differences between scientific and everyday (non-scientific) statements is essential to our ability to accurately evaluate the trustworthiness of various claims.
Scientific and everyday reasoning both employ induction: drawing general conclusions from specific observations. For example, a person’s opinion that cramming for a test increases performance may be based on her memory of passing an exam after pulling an all-night study session. Similarly, a researcher’s conclusion against cramming might be based on studies comparing the test performances of people who studied the material in different ways (e.g., cramming versus study sessions spaced out over time). In these scenarios, both scientific and everyday conclusions are drawn from a limited sample of potential observations.
The process of induction, alone, does not seem suitable enough to provide trustworthy information—given the contradictory results. What should a student who wants to perform well on exams do? One source of information encourages her to cram, while another suggests that spacing out her studying time is the best strategy. To make the best decision with the information at hand, we need to appreciate the differences between personal opinions and scientific statements, which requires an understanding of science and the nature of scientific reasoning.
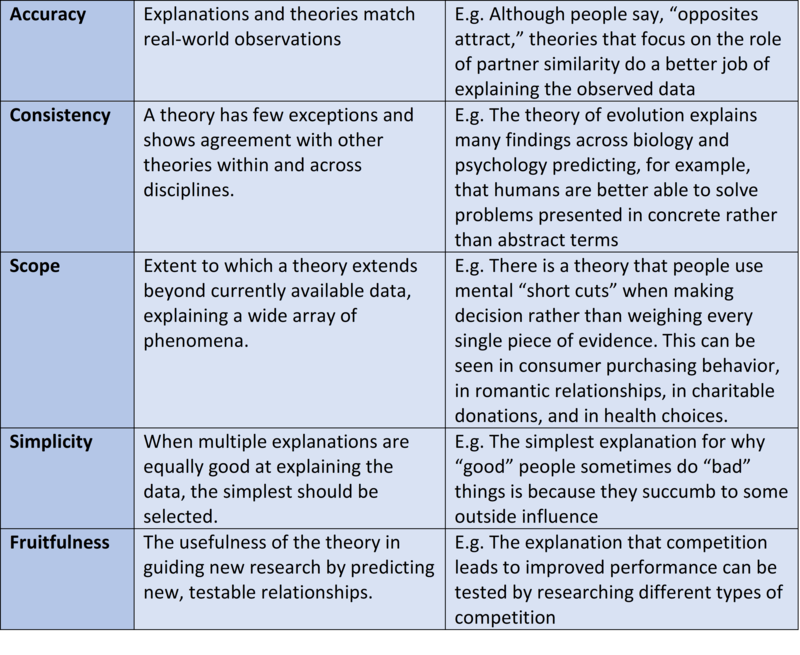
There are generally agreed-upon features that distinguish scientific thinking—and the theories and data generated by it—from everyday thinking. A short list of some of the commonly cited features of scientific theories and data is shown in Table 1.
One additional feature of modern science not included in this list but prevalent in scientists’ thinking and theorizing is falsifiability, a feature that has so permeated scientific practice that it warrants additional clarification. In the early 20th century, Karl Popper (1902-1994) suggested that science can be distinguished from pseudoscience (or just everyday reasoning) because scientific claims are capable of being falsified. That is, a claim can be conceivably demonstrated to be untrue. For example, a person might claim that “all people are right handed.” This claim can be tested and—ultimately—thrown out because it can be shown to be false: There are people who are left-handed. An easy rule of thumb is to not get confused by the term “falsifiable” but to understand that—more or less—it means testable.
On the other hand, some claims cannot be tested and falsified. Imagine, for instance, that a magician claims that he can teach people to move objects with their minds. The trick, he explains, is to truly believe in one’s ability for it to work. When his students fail to budge chairs with their minds, the magician scolds, “Obviously, you don’t truly believe.” The magician’s claim does not qualify as falsifiable because there is no way to disprove it. It is unscientific.
Popper was particularly irritated about nonscientific claims because he believed they were a threat to the science of psychology. Specifically, he was dissatisfied with Freud’s explanations for mental illness. Freud believed that when a person suffers a mental illness it is often due to problems stemming from childhood. For instance, imagine a person who grows up to be an obsessive perfectionist. If she were raised by messy, relaxed parents, Freud might argue that her adult perfectionism is a reaction to her early family experiences—an effort to maintain order and routine instead of chaos. Alternatively, imagine the same person being raised by harsh, orderly parents. In this case, Freud might argue that her adult tidiness is simply her internalizing her parents’ way of being. As you can see, according to Freud’s rationale, both opposing scenarios are possible; no matter what the disorder, Freud’s theory could explain its childhood origin—thus failing to meet the principle of falsifiability.

Popper argued against statements that could not be falsified. He claimed that they blocked scientific progress: There was no way to advance, refine, or refute knowledge based on such claims. Popper’s solution was a powerful one: If science showed all the possibilities that were not true, we would be left only with what is true. That is, we need to be able to articulate—beforehand—the kinds of evidence that will disprove our hypothesis and cause us to abandon it.
This may seem counterintuitive. For example, if a scientist wanted to establish a comprehensive understanding of why car accidents happen, she would systematically test all potential causes: alcohol consumption, speeding, using a cell phone, fiddling with the radio, wearing sandals, eating, chatting with a passenger, etc. A complete understanding could only be achieved once all possible explanations were explored and either falsified or not. After all the testing was concluded, the evidence would be evaluated against the criteria for falsification, and only the real causes of accidents would remain. The scientist could dismiss certain claims (e.g., sandals lead to car accidents) and keep only those supported by research (e.g., using a mobile phone while driving increases risk). It might seem absurd that a scientist would need to investigate so many alternative explanations, but it is exactly how we rule out bad claims. Of course, many explanations are complicated and involve multiple causes—as with car accidents, as well as psychological phenomena.
Test Yourself 1: Can It Be Falsified?
Which of the following hypotheses can be falsified? For each, be sure to consider what kind of data could be collected to demonstrate that a statement is not true.
A. Chocolate tastes better than pasta.
B. We live in the most violent time in history.
C. Time can run backward as well as forward.
D. There are planets other than Earth that have water on them.
[See answer at end of this module]
Although the idea of falsification remains central to scientific data and theory development, these days it’s not used strictly the way Popper originally envisioned it. To begin with, scientists aren’t solely interested in demonstrating what isn’t. Scientists are also interested in providing descriptions and explanations for the way things are. We want to describe different causes and the various conditions under which they occur. We want to discover when young children start speaking in complete sentences, for example, or whether people are happier on the weekend, or how exercise impacts depression. These explorations require us to draw conclusions from limited samples of data. In some cases, these data seem to fit with our hypotheses and in others they do not. This is where interpretation and probability come in.
The Interpretation of Research Results
Imagine a researcher wanting to examine the hypothesis—a specific prediction based on previous research or scientific theory—that caffeine enhances memory. She knows there are several published studies that suggest this might be the case, and she wants to further explore the possibility. She designs an experiment to test this hypothesis. She randomly assigns some participants a cup of fully caffeinated tea and some a cup of herbal tea. All the participants are instructed to drink up, study a list of words, then complete a memory test. There are three possible outcomes of this proposed study:

- The caffeine group performs better (support for the hypothesis).
- The no-caffeine group performs better (evidence against the hypothesis).
- There is no difference in the performance between the two groups (also evidence against the hypothesis).
Let’s look, from a scientific point of view, at how the researcher should interpret each of these three possibilities.
First, if the results of the memory test reveal that the caffeine group performs better, this is a piece of evidence in favor of the hypothesis: It appears, at least in this case, that caffeine is associated with better memory. It does not, however, prove that caffeine is associated with better memory. There are still many questions left unanswered. How long does the memory boost last? Does caffeine work the same way with people of all ages? Is there a difference in memory performance between people who drink caffeine regularly and those who never drink it? Could the results be a freak occurrence? Because of these uncertainties, we do not say that a study—especially a single study—proves a hypothesis. Instead, we say the results of the study offer evidence in support of the hypothesis. Even if we tested this across 10 thousand or 100 thousand people we still could not use the word “proven” to describe this phenomenon. This is because inductive reasoning is based on probabilities. Probabilities are always a matter of degree; they may be extremely likely or unlikely. Science is better at shedding light on the likelihood—or probability—of something than at proving it. In this way, data is still highly useful even if it doesn’t fit Popper’s absolute standards.
The science of meteorology helps illustrate this point. You might look at your local weather forecast and see a high likelihood of rain. This is because the meteorologist has used inductive reasoning to create her forecast. She has taken current observations—lots of dense clouds coming toward your city—and compared them to historical weather patterns associated with rain, making a reasonable prediction of a high probability of rain. The meteorologist has not proven it will rain, however, by pointing out the oncoming clouds.
Proof is more associated with deductive reasoning. Deductive reasoning starts with general principles that are applied to specific instances (the reverse of inductive reasoning). When the general principles, or premises, are true, and the structure of the argument is valid, the conclusion is, by definition, proven; it must be so. A deductive truth must apply in all relevant circumstances. For example, all living cells contain DNA. From this, you can reason—deductively—that any specific living cell (of an elephant, or a person, or a snake) will therefore contain DNA. Given the complexity of psychological phenomena, which involve many contributing factors, it is nearly impossible to make these types of broad statements with certainty.
Test Yourself 2: Inductive or Deductive?
A. The stove was on and the water in the pot was boiling over. The front door was standing open. These clues suggest the homeowner left unexpectedly and in a hurry.
B. Gravity is associated with mass. Because the moon has a smaller mass than the Earth, it should have weaker gravity.
C. Students don’t like to pay for high priced textbooks. It is likely that many students in the class will opt not to purchase a book.
D. To earn a college degree, students need 100 credits. Janine has 85 credits, so she cannot graduate.
[See answer at end of this module]
The second possible result from the caffeine-memory study is that the group who had no caffeine demonstrates better memory. This result is the opposite of what the researcher expects to find (her hypothesis). Here, the researcher must admit the evidence does not support her hypothesis. She must be careful, however, not to extend that interpretation to other claims. For example, finding increased memory in the no-caffeine group would not be evidence that caffeine harms memory. Again, there are too many unknowns. Is this finding a freak occurrence, perhaps based on an unusual sample? Is there a problem with the design of the study? The researcher doesn’t know. She simply knows that she was not able to observe support for her hypothesis.
There is at least one additional consideration: The researcher originally developed her caffeine-benefits-memory hypothesis based on conclusions drawn from previous research. That is, previous studies found results that suggested caffeine boosts memory. The researcher’s single study should not outweigh the conclusions of many studies. Perhaps the earlier research employed participants of different ages or who had different baseline levels of caffeine intake. This new study simply becomes a piece of fabric in the overall quilt of studies of the caffeine-memory relationship. It does not, on its own, definitively falsify the hypothesis.
Finally, it’s possible that the results show no difference in memory between the two groups. How should the researcher interpret this? How would you? In this case, the researcher once again has to admit that she has not found support for her hypothesis.
Interpreting the results of a study—regardless of outcome—rests on the quality of the observations from which those results are drawn. If you learn, say, that each group in a study included only four participants, or that they were all over 90 years old, you might have concerns. Specifically, you should be concerned that the observations, even if accurate, aren’t representative of the general population. This is one of the defining differences between conclusions drawn from personal anecdotes and those drawn from scientific observations. Anecdotal evidence—derived from personal experience and unsystematic observations (e.g., “common sense,”)—is limited by the quality and representativeness of observations, and by memory shortcomings. Well-designed research, on the other hand, relies on observations that are systematically recorded, of high quality, and representative of the population it claims to describe.
Why Should I Trust Science If It Can’t Prove Anything?
It’s worth delving a bit deeper into why we ought to trust the scientific inductive process, even when it relies on limited samples that don’t offer absolute “proof.” To do this, let’s examine a widespread practice in psychological science: null-hypothesis significance testing.

To understand this concept, let’s begin with another research example. Imagine, for instance, a researcher is curious about the ways maturity affects academic performance. She might have a hypothesis that mature students are more likely to be responsible about studying and completing homework and, therefore, will do better in their courses. To test this hypothesis, the researcher needs a measure of maturity and a measure of course performance. She might calculate the correlation—or relationship—between student age (her measure of maturity) and points earned in a course (her measure of academic performance). Ultimately, the researcher is interested in the likelihood—or probability—that these two variables closely relate to one another. Null-hypothesis significance testing (NHST) assesses the probability that the collected data (the observations) would be the same if there were no relationship between the variables in the study. Using our example, the NHST would test the probability that the researcher would find a link between age and class performance if there were, in reality, no such link.
Now, here’s where it gets a little complicated. NHST involves a null hypothesis, a statement that two variables are not related (in this case, that student maturity and academic performance are not related in any meaningful way). NHST also involves an alternative hypothesis, a statement that two variables are related (in this case, that student maturity and academic performance go together). To evaluate these two hypotheses, the researcher collects data. The researcher then compares what she expects to find (probability) with what she actually finds (the collected data) to determine whether she can falsify, or reject, the null hypothesis in favor of the alternative hypothesis.
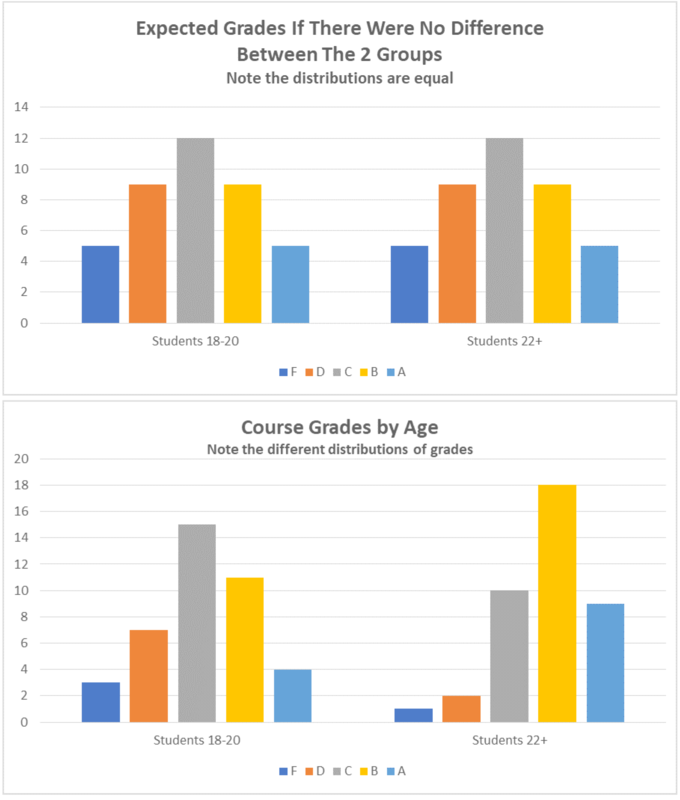
How does she do this? By looking at the distribution of the data. The distribution is the spread of values—in our example, the numeric values of students’ scores in the course. The researcher will test her hypothesis by comparing the observed distribution of grades earned by older students to those earned by younger students, recognizing that some distributions are more or less likely. Your intuition tells you, for example, that the chances of every single person in the course getting a perfect score are lower than their scores being distributed across all levels of performance.
The researcher can use a probability table to assess the likelihood of any distribution she finds in her class. These tables reflect the work, over the past 200 years, of mathematicians and scientists from a variety of fields. You can see, in Table 2a, an example of an expected distribution if the grades were normally distributed (most are average, and relatively few are amazing or terrible). In Table 2b, you can see possible results of this imaginary study, and can clearly see how they differ from the expected distribution.
In the process of testing these hypotheses, there are four possible outcomes. These are determined by two factors: 1) reality, and 2) what the researcher finds (see Table 3). The best possible outcome is accurate detection. This means that the researcher’s conclusion mirrors reality. In our example, let’s pretend the more mature students do perform slightly better. If this is what the researcher finds in her data, her analysis qualifies as an accurate detection of reality. Another form of accurate detection is when a researcher finds no evidence for a phenomenon, but that phenomenon doesn’t actually exist anyway! Using this same example, let’s now pretend that maturity has nothing to do with academic performance. Perhaps academic performance is instead related to intelligence or study habits. If the researcher finds no evidence for a link between maturity and grades and none actually exists, she will have also achieved accurate detection.
There are a couple of ways that research conclusions might be wrong. One is referred to as a type I error—when the researcher concludes there is a relationship between two variables but, in reality, there is not. Back to our example: Let’s now pretend there’s no relationship between maturity and grades, but the researcher still finds one. Why does this happen? It may be that her sample, by chance, includes older students who also have better study habits and perform better: The researcher has “found” a relationship (the data appearing to show age as significantly correlated with academic performance), but the truth is that the apparent relationship is purely coincidental—the result of these specific older students in this particular sample having better-than-average study habits (the real cause of the relationship). They may have always had superior study habits, even when they were young.
Another possible outcome of NHST is a type II error, when the data fail to show a relationship between variables that actually exists. In our example, this time pretend that maturity is —in reality—associated with academic performance, but the researcher doesn’t find it in her sample. Perhaps it was just her bad luck that her older students are just having an off day, suffering from test anxiety, or were uncharacteristically careless with their homework: The peculiarities of her particular sample, by chance, prevent the researcher from identifying the real relationship between maturity and academic performance.
These types of errors might worry you, that there is just no way to tell if data are any good or not. Researchers share your concerns, and address them by using probability values (p-values) to set a threshold for type I or type II errors. When researchers write that a particular finding is “significant at a p < .05 level,” they’re saying that if the same study were repeated 100 times, we should expect this result to occur—by chance—fewer than five times. That is, in this case, a Type I error is unlikely. Scholars sometimes argue over the exact threshold that should be used for probability. The most common in psychological science are .05 (5% chance), .01 (1% chance), and .001 (1/10th of 1% chance). Remember, psychological science doesn’t rely on definitive proof; it’s about the probability of seeing a specific result. This is also why it’s so important that scientific findings be replicated in additional studies.

It’s because of such methodologies that science is generally trustworthy. Not all claims and explanations are equal; some conclusions are better bets, so to speak. Scientific claims are more likely to be correct and predict real outcomes than “common sense” opinions and personal anecdotes. This is because researchers consider how to best prepare and measure their subjects, systematically collect data from large and—ideally—representative samples, and test their findings against probability.
Scientific Theories
The knowledge generated from research is organized according to scientific theories. A scientific theory is a comprehensive framework for making sense of evidence regarding a particular phenomenon. When scientists talk about a theory, they mean something different from how the term is used in everyday conversation. In common usage, a theory is an educated guess—as in, “I have a theory about which team will make the playoffs,” or, “I have a theory about why my sister is always running late for appointments.” Both of these beliefs are liable to be heavily influenced by many untrustworthy factors, such as personal opinions and memory biases. A scientific theory, however, enjoys support from many research studies, collectively providing evidence, including, but not limited to, that which has falsified competing explanations. A key component of good theories is that they describe, explain, and predict in a way that can be empirically tested and potentially falsified.

Theories are open to revision if new evidence comes to light that compels reexamination of the accumulated, relevant data. In ancient times, for instance, people thought the Sun traveled around the Earth. This seemed to make sense and fit with many observations. In the 16th century, however, astronomers began systematically charting visible objects in the sky, and, over a 50-year period, with repeated testing, critique, and refinement, they provided evidence for a revised theory: The Earth and other cosmic objects revolve around the Sun. In science, we believe what the best and most data tell us. If better data come along, we must be willing to change our views in accordance with the new evidence.
Is Science Objective?
Thomas Kuhn (2012), a historian of science, argued that science, as an activity conducted by humans, is a social activity. As such, it is—according to Kuhn—subject to the same psychological influences of all human activities. Specifically, Kuhn suggested that there is no such thing as objective theory or data; all of science is informed by values. Scientists cannot help but let personal/cultural values, experiences, and opinions influence the types of questions they ask and how they make sense of what they find in their research. Kuhn’s argument highlights a distinction between facts (information about the world), and values (beliefs about the way the world is or ought to be). This distinction is an important one, even if it is not always clear.
To illustrate the relationship between facts and values, consider the problem of global warming. A vast accumulation of evidence (facts) substantiates the adverse impact that human activity has on the levels of greenhouse gases in Earth’s atmosphere leading to changing weather patterns. There is also a set of beliefs (values), shared by many people, that influences their choices and behaviors in an attempt to address that impact (e.g., purchasing electric vehicles, recycling, bicycle commuting). Our values—in this case, that Earth as we know it is in danger and should be protected—influence how we engage with facts. People (including scientists) who strongly endorse this value, for example, might be more attentive to research on renewable energy.
The primary point of this illustration is that (contrary to the image of scientists as outside observers to the facts, gathering them neutrally and without bias from the natural world) all science—especially social sciences like psychology—involves values and interpretation. As a result, science functions best when people with diverse values and backgrounds work collectively to understand complex natural phenomena.

Indeed, science can benefit from multiple perspectives. One approach to achieving this is through levels of analysis. Levels of analysis is the idea that a single phenomenon may be explained at different levels simultaneously. Remember the question concerning cramming for a test versus studying over time? It can be answered at a number of different levels of analysis. At a low level, we might use brain scanning technologies to investigate whether biochemical processes differ between the two study strategies. At a higher level—the level of thinking—we might investigate processes of decision making (what to study) and ability to focus, as they relate to cramming versus spaced practice. At even higher levels, we might be interested in real world behaviors, such as how long people study using each of the strategies. Similarly, we might be interested in how the presence of others influences learning across these two strategies. Levels of analysis suggests that one level is not more correct—or truer—than another; their appropriateness depends on the specifics of the question asked. Ultimately, levels of analysis would suggest that we cannot understand the world around us, including human psychology, by reducing the phenomenon to only the biochemistry of genes and dynamics of neural networks. But, neither can we understand humanity without considering the functions of the human nervous system.
Science in Context
There are many ways to interpret the world around us. People rely on common sense, personal experience, and faith, in combination and to varying degrees. All of these offer legitimate benefits to navigating one’s culture, and each offers a unique perspective, with specific uses and limitations. Science provides another important way of understanding the world and, while it has many crucial advantages, as with all methods of interpretation, it also has limitations. Understanding the limits of science—including its subjectivity and uncertainty—does not render it useless. Because it is systematic, using testable, reliable data, it can allow us to determine causality and can help us generalize our conclusions. By understanding how scientific conclusions are reached, we are better equipped to use science as a tool of knowledge.
Answer – Test Yourself 1: Can It Be Falsified?
Answer explained: There are 4 hypotheses presented. Basically, the question asks “which of these could be tested and demonstrated to be false?”. We can eliminate answers A, B and C. A is a matter of personal opinion. C is a concept for which there are currently no existing measures. B is a little trickier. A person could look at data on wars, assaults, and other forms of violence to draw a conclusion about which period is the most violent. The problem here is that we do not have data for all time periods, and there is no clear guide to which data should be used to address this hypothesis. The best answer is D, because we have the means to view other planets and to determine whether there is water on them (for example, Mars has ice).
Answer – Test Yourself 2: Inductive or Deductive
Answer explained: This question asks you to consider whether each of 5 examples represents inductive or deductive reasoning. 1) Inductive—it is possible to draw the conclusion—the homeowner left in a hurry—from specific observations such as the stove being on and the door being open. 2) Deductive—starting with a general principle (gravity is associated with mass), we draw a conclusion about the moon having weaker gravity than does the Earth because it has smaller mass. 3) Deductive—starting with a general principle (students do not like to pay for textbooks) it is possible to make a prediction about likely student behavior (they will not purchase textbooks). Note that this is a case of prediction rather than using observations. 4) Deductive—starting with a general principle (students need 100 credits to graduate) it is possible to draw a conclusion about Janine (she cannot graduate because she has fewer than the 100 credits required).
Research Designs
Singapore Management University
Psychologists test research questions using a variety of methods. Most research relies on either correlations or experiments. With correlations, researchers measure variables as they naturally occur in people and compute the degree to which two variables go together. With experiments, researchers actively make changes in one variable and watch for changes in another variable. Experiments allow researchers to make causal inferences. Other types of methods include longitudinal and quasi-experimental designs. Many factors, including practical constraints, determine the type of methods researchers use. Often researchers survey people even though it would be better, but more expensive and time consuming, to track them longitudinally.
Learning Objectives
- Articulate the difference between correlational and experimental designs.
- Understand how to interpret correlations.
- Understand how experiments help us to infer causality.
- Understand how surveys relate to correlational and experimental research.
- Explain what a longitudinal study is.
- List a strength and weakness of different research designs.
Research Designs
In the early 1970’s, a man named Uri Geller tricked the world: he convinced hundreds of thousands of people that he could bend spoons and slow watches using only the power of his mind. In fact, if you were in the audience, you would have likely believed he had psychic powers. Everything looked authentic—this man had to have paranormal abilities! So, why have you probably never heard of him before? Because when Uri was asked to perform his miracles in line with scientific experimentation, he was no longer able to do them. That is, even though it seemed like he was doing the impossible, when he was tested by science, he proved to be nothing more than a clever magician.
When we look at dinosaur bones to make educated guesses about extinct life, or systematically chart the heavens to learn about the relationships between stars and planets, or study magicians to figure out how they perform their tricks, we are forming observations—the foundation of science. Although we are all familiar with the saying “seeing is believing,” conducting science is more than just what your eyes perceive. Science is the result of systematic and intentional study of the natural world. And psychology is no different. In the movie Jerry Maguire, Cuba Gooding, Jr. became famous for using the phrase, “Show me the money!” In psychology, as in all sciences, we might say, “Show me the data!”
One of the important steps in scientific inquiry is to test our research questions, otherwise known as hypotheses. However, there are many ways to test hypotheses in psychological research. Which method you choose will depend on the type of questions you are asking, as well as what resources are available to you. All methods have limitations, which is why the best research uses a variety of methods.
Most psychological research can be divided into two types: experimental and correlational research.
Experimental Research
If somebody gave you $20 that absolutely had to be spent today, how would you choose to spend it? Would you spend it on an item you’ve been eyeing for weeks, or would you donate the money to charity? Which option do you think would bring you the most happiness? If you’re like most people, you’d choose to spend the money on yourself (duh, right?). Our intuition is that we’d be happier if we spent the money on ourselves.

Knowing that our intuition can sometimes be wrong, Professor Elizabeth Dunn (2008) at the University of British Columbia set out to conduct an experiment on spending and happiness. She gave each of the participants in her experiment $20 and then told them they had to spend the money by the end of the day. Some of the participants were told they must spend the money on themselves, and some were told they must spend the money on others (either charity or a gift for someone). At the end of the day she measured participants’ levels of happiness using a self-report questionnaire. (But wait, how do you measure something like happiness when you can’t really see it? Psychologists measure many abstract concepts, such as happiness and intelligence, by beginning with operational definitions of the concepts. See the Noba modules on Intelligence [http://noba.to/ncb2h79v] and Happiness [http://noba.to/qnw7g32t], respectively, for more information on specific measurement strategies.)
In an experiment, researchers manipulate, or cause changes, in the independent variable, and observe or measure any impact of those changes in the dependent variable. The independent variable is the one under the experimenter’s control, or the variable that is intentionally altered between groups. In the case of Dunn’s experiment, the independent variable was whether participants spent the money on themselves or on others. The dependent variable is the variable that is not manipulated at all, or the one where the effect happens. One way to help remember this is that the dependent variable “depends” on what happens to the independent variable. In our example, the participants’ happiness (the dependent variable in this experiment) depends on how the participants spend their money (the independent variable). Thus, any observed changes or group differences in happiness can be attributed to whom the money was spent on. What Dunn and her colleagues found was that, after all the spending had been done, the people who had spent the money on others were happier than those who had spent the money on themselves. In other words, spending on others causes us to be happier than spending on ourselves. Do you find this surprising?
But wait! Doesn’t happiness depend on a lot of different factors—for instance, a person’s upbringing or life circumstances? What if some people had happy childhoods and that’s why they’re happier? Or what if some people dropped their toast that morning and it fell jam-side down and ruined their whole day? It is correct to recognize that these factors and many more can easily affect a person’s level of happiness. So how can we accurately conclude that spending money on others causes happiness, as in the case of Dunn’s experiment?
The most important thing about experiments is random assignment. Participants don’t get to pick which condition they are in (e.g., participants didn’t choose whether they were supposed to spend the money on themselves versus others). The experimenter assigns them to a particular condition based on the flip of a coin or the roll of a die or any other random method. Why do researchers do this? With Dunn’s study, there is the obvious reason: you can imagine which condition most people would choose to be in, if given the choice. But another equally important reason is that random assignment makes it so the groups, on average, are similar on all characteristics except what the experimenter manipulates.
By randomly assigning people to conditions (self-spending versus other-spending), some people with happy childhoods should end up in each condition. Likewise, some people who had dropped their toast that morning (or experienced some other disappointment) should end up in each condition. As a result, the distribution of all these factors will generally be consistent across the two groups, and this means that on average the two groups will be relatively equivalent on all these factors. Random assignment is critical to experimentation because if the only difference between the two groups is the independent variable, we can infer that the independent variable is the cause of any observable difference (e.g., in the amount of happiness they feel at the end of the day).
Here’s another example of the importance of random assignment: Let’s say your class is going to form two basketball teams, and you get to be the captain of one team. The class is to be divided evenly between the two teams. If you get to pick the players for your team first, whom will you pick? You’ll probably pick the tallest members of the class or the most athletic. You probably won’t pick the short, uncoordinated people, unless there are no other options. As a result, your team will be taller and more athletic than the other team. But what if we want the teams to be fair? How can we do this when we have people of varying height and ability? All we have to do is randomly assign players to the two teams. Most likely, some tall and some short people will end up on your team, and some tall and some short people will end up on the other team. The average height of the teams will be approximately the same. That is the power of random assignment!
Other considerations
In addition to using random assignment, you should avoid introducing confounds into your experiments. Confounds are things that could undermine your ability to draw causal inferences. For example, if you wanted to test if a new happy pill will make people happier, you could randomly assign participants to take the happy pill or not (the independent variable) and compare these two groups on their self-reported happiness (the dependent variable). However, if some participants know they are getting the happy pill, they might develop expectations that influence their self-reported happiness. This is sometimes known as a placebo effect. Sometimes a person just knowing that he or she is receiving special treatment or something new is enough to actually cause changes in behavior or perception: In other words, even if the participants in the happy pill condition were to report being happier, we wouldn’t know if the pill was actually making them happier or if it was the placebo effect—an example of a confound. A related idea is participant demand. This occurs when participants try to behave in a way they think the experimenter wants them to behave. Placebo effects and participant demand often occur unintentionally. Even experimenter expectations can influence the outcome of a study. For example, if the experimenter knows who took the happy pill and who did not, and the dependent variable is the experimenter’s observations of people’s happiness, then the experimenter might perceive improvements in the happy pill group that are not really there.
One way to prevent these confounds from affecting the results of a study is to use a double-blind procedure. In a double-blind procedure, neither the participant nor the experimenter knows which condition the participant is in. For example, when participants are given the happy pill or the fake pill, they don’t know which one they are receiving. This way the participants shouldn’t experience the placebo effect, and will be unable to behave as the researcher expects (participant demand). Likewise, the researcher doesn’t know which pill each participant is taking (at least in the beginning—later, the researcher will get the results for data-analysis purposes), which means the researcher’s expectations can’t influence his or her observations. Therefore, because both parties are “blind” to the condition, neither will be able to behave in a way that introduces a confound. At the end of the day, the only difference between groups will be which pills the participants received, allowing the researcher to determine if the happy pill actually caused people to be happier.
Correlational Designs
When scientists passively observe and measure phenomena it is called correlational research. Here, we do not intervene and change behavior, as we do in experiments. In correlational research, we identify patterns of relationships, but we usually cannot infer what causes what. Importantly, with correlational research, you can examine only two variables at a time, no more and no less.
So, what if you wanted to test whether spending on others is related to happiness, but you don’t have $20 to give to each participant? You could use a correlational design—which is exactly what Professor Dunn did, too. She asked people how much of their income they spent on others or donated to charity, and later she asked them how happy they were. Do you think these two variables were related? Yes, they were! The more money people reported spending on others, the happier they were.
More details about the correlation
To find out how well two variables correspond, we can plot the relation between the two scores on what is known as a scatterplot (Figure 1). In the scatterplot, each dot represents a data point. (In this case it’s individuals, but it could be some other unit.) Importantly, each dot provides us with two pieces of information—in this case, information about how good the person rated the past month (x-axis) and how happy the person felt in the past month (y-axis). Which variable is plotted on which axis does not matter.
")
The association between two variables can be summarized statistically using the correlation coefficient (abbreviated as r). A correlationcoefficient provides information about the direction and strength of the association between two variables. For the example above, the direction of the association is positive. This means that people who perceived the past month as being good reported feeling more happy, whereas people who perceived the month as being bad reported feeling less happy.
With a positive correlation, the two variables go up or down together. In a scatterplot, the dots form a pattern that extends from the bottom left to the upper right (just as they do in Figure 1). The r value for a positive correlation is indicated by a positive number (although, the positive sign is usually omitted). Here, the r value is .81.
A negative correlation is one in which the two variables move in opposite directions. That is, as one variable goes up, the other goes down. Figure 2 shows the association between the average height of males in a country (y-axis) and the pathogen prevalence (or commonness of disease; x-axis) of that country. In this scatterplot, each dot represents a country. Notice how the dots extend from the top left to the bottom right. What does this mean in real-world terms? It means that people are shorter in parts of the world where there is more disease. The r value for a negative correlation is indicated by a negative number—that is, it has a minus (–) sign in front of it. Here, it is –.83.
.")
The strength of a correlation has to do with how well the two variables align. Recall that in Professor Dunn’s correlational study, spending on others positively correlated with happiness: The more money people reported spending on others, the happier they reported to be. At this point you may be thinking to yourself, I know a very generous person who gave away lots of money to other people but is miserable! Or maybe you know of a very stingy person who is happy as can be. Yes, there might be exceptions. If an association has many exceptions, it is considered a weak correlation. If an association has few or no exceptions, it is considered a strong correlation. A strong correlation is one in which the two variables always, or almost always, go together. In the example of happiness and how good the month has been, the association is strong. The stronger a correlation is, the tighter the dots in the scatterplot will be arranged along a sloped line.
The r value of a strong correlation will have a high absolute value. In other words, you disregard whether there is a negative sign in front of the r value, and just consider the size of the numerical value itself. If the absolute value is large, it is a strong correlation. A weak correlation is one in which the two variables correspond some of the time, but not most of the time. Figure 3 shows the relation between valuing happiness and grade point average (GPA). People who valued happiness more tended to earn slightly lower grades, but there were lots of exceptions to this. The r value for a weak correlation will have a low absolute value. If two variables are so weakly related as to be unrelated, we say they are uncorrelated, and the r value will be zero or very close to zero. In the previous example, is the correlation between height and pathogen prevalence strong? Compared to Figure 3, the dots in Figure 2 are tighter and less dispersed. The absolute value of –.83 is large. Therefore, it is a strong negative correlation.
.")
Can you guess the strength and direction of the correlation between age and year of birth? If you said this is a strong negative correlation, you are correct! Older people always have lower years of birth than younger people (e.g., 1950 vs. 1995), but at the same time, the older people will have a higher age (e.g., 65 vs. 20). In fact, this is a perfect correlation because there are no exceptions to this pattern. I challenge you to find a 10-year-old born before 2003! You can’t.
Problems with the correlation
If generosity and happiness are positively correlated, should we conclude that being generous causes happiness? Similarly, if height and pathogen prevalence are negatively correlated, should we conclude that disease causes shortness? From a correlation alone, we can’t be certain. For example, in the first case it may be that happiness causes generosity, or that generosity causes happiness. Or, a third variable might cause both happiness andgenerosity, creating the illusion of a direct link between the two. For example, wealth could be the third variable that causes both greater happiness and greater generosity. This is why correlation does not mean causation—an often repeated phrase among psychologists.
Qualitative Designs
Just as correlational research allows us to study topics we can’t experimentally manipulate (e.g., whether you have a large or small income), there are other types of research designs that allow us to investigate these harder-to-study topics. Qualitative designs, including participant observation, case studies, and narrative analysis are examples of such methodologies. Although something as simple as “observation” may seem like it would be a part of all research methods, participant observation is a distinct methodology that involves the researcher embedding him- or herself into a group in order to study its dynamics. For example, Festinger, Riecken, and Shacter (1956) were very interested in the psychology of a particular cult. However, this cult was very secretive and wouldn’t grant interviews to outside members. So, in order to study these people, Festinger and his colleagues pretended to be cult members, allowing them access to the behavior and psychology of the cult. Despite this example, it should be noted that the people being observed in a participant observation study usually know that the researcher is there to study them.
Another qualitative method for research is the case study, which involves an intensive examination of specific individuals or specific contexts. Sigmund Freud, the father of psychoanalysis, was famous for using this type of methodology; however, more current examples of case studies usually involve brain injuries. For instance, imagine that researchers want to know how a very specific brain injury affects people’s experience of happiness. Obviously, the researchers can’t conduct experimental research that involves inflicting this type of injury on people. At the same time, there are too few people who have this type of injury to conduct correlational research. In such an instance, the researcher may examine only one person with this brain injury, but in doing so, the researcher will put the participant through a very extensive round of tests. Hopefully what is learned from this one person can be applied to others; however, even with thorough tests, there is the chance that something unique about this individual (other than the brain injury) will affect his or her happiness. But with such a limited number of possible participants, a case study is really the only type of methodology suitable for researching this brain injury.
The final qualitative method to be discussed in this section is narrative analysis. Narrative analysis centers around the study of stories and personal accounts of people, groups, or cultures. In this methodology, rather than engaging with participants directly, or quantifying their responses or behaviors, researchers will analyze the themes, structure, and dialogue of each person’s narrative. That is, a researcher will examine people’s personal testimonies in order to learn more about the psychology of those individuals or groups. These stories may be written, audio-recorded, or video-recorded, and allow the researcher not only to study what the participant says but how he or she says it. Every person has a unique perspective on the world, and studying the way he or she conveys a story can provide insight into that perspective.
Quasi-Experimental Designs
What if you want to study the effects of marriage on a variable? For example, does marriage make people happier? Can you randomly assign some people to get married and others to remain single? Of course not. So how can you study these important variables? You can use a quasi-experimental design.

A quasi-experimental design is similar to experimental research, except that random assignment to conditions is not used. Instead, we rely on existing group memberships (e.g., married vs. single). We treat these as the independent variables, even though we don’t assign people to the conditions and don’t manipulate the variables. As a result, with quasi-experimental designs causal inference is more difficult. For example, married people might differ on a variety of characteristics from unmarried people. If we find that married participants are happier than single participants, it will be hard to say that marriage causes happiness, because the people who got married might have already been happier than the people who have remained single.
Because experimental and quasi-experimental designs can seem pretty similar, let’s take another example to distinguish them. Imagine you want to know who is a better professor: Dr. Smith or Dr. Khan. To judge their ability, you’re going to look at their students’ final grades. Here, the independent variable is the professor (Dr. Smith vs. Dr. Khan) and the dependent variable is the students’ grades. In an experimental design, you would randomly assign students to one of the two professors and then compare the students’ final grades. However, in real life, researchers can’t randomly force students to take one professor over the other; instead, the researchers would just have to use the preexisting classes and study them as-is (quasi-experimental design). Again, the key difference is random assignment to the conditions of the independent variable. Although the quasi-experimental design (where the students choose which professor they want) may seem random, it’s most likely not. For example, maybe students heard Dr. Smith sets low expectations, so slackers prefer this class, whereas Dr. Khan sets higher expectations, so smarter students prefer that one. This now introduces a confounding variable (student intelligence) that will almost certainly have an effect on students’ final grades, regardless of how skilled the professor is. So, even though a quasi-experimental design is similar to an experimental design (i.e., it has a manipulated independent variable), because there’s no random assignment, you can’t reasonably draw the same conclusions that you would with an experimental design.
Longitudinal Studies
Another powerful research design is the longitudinal study. Longitudinal studies track the same people over time. Some longitudinal studies last a few weeks, some a few months, some a year or more. Some studies that have contributed a lot to psychology followed the same people over decades. For example, one study followed more than 20,000 Germans for two decades. From these longitudinal data, psychologist Rich Lucas (2003) was able to determine that people who end up getting married indeed start off a bit happier than their peers who never marry. Longitudinal studies like this provide valuable evidence for testing many theories in psychology, but they can be quite costly to conduct, especially if they follow many people for many years.
Surveys

A survey is a way of gathering information, using old-fashioned questionnaires or the Internet. Compared to a study conducted in a psychology laboratory, surveys can reach a larger number of participants at a much lower cost. Although surveys are typically used for correlational research, this is not always the case. An experiment can be carried out using surveys as well. For example, King and Napa (1998) presented participants with different types of stimuli on paper: either a survey completed by a happy person or a survey completed by an unhappy person. They wanted to see whether happy people were judged as more likely to get into heaven compared to unhappy people. Can you figure out the independent and dependent variables in this study? Can you guess what the results were? Happy people (vs. unhappy people; the independent variable) were judged as more likely to go to heaven (the dependent variable) compared to unhappy people!
Likewise, correlational research can be conducted without the use of surveys. For instance, psychologists LeeAnn Harker and Dacher Keltner (2001) examined the smile intensity of women’s college yearbook photos. Smiling in the photos was correlated with being married 10 years later!
Tradeoffs in Research
Even though there are serious limitations to correlational and quasi-experimental research, they are not poor cousins to experiments and longitudinal designs. In addition to selecting a method that is appropriate to the question, many practical concerns may influence the decision to use one method over another. One of these factors is simply resource availability—how much time and money do you have to invest in the research? (Tip: If you’re doing a senior honor’s thesis, do not embark on a lengthy longitudinal study unless you are prepared to delay graduation!) Often, we survey people even though it would be more precise—but much more difficult—to track them longitudinally. Especially in the case of exploratory research, it may make sense to opt for a cheaper and faster method first. Then, if results from the initial study are promising, the researcher can follow up with a more intensive method.
Beyond these practical concerns, another consideration in selecting a research design is the ethics of the study. For example, in cases of brain injury or other neurological abnormalities, it would be unethical for researchers to inflict these impairments on healthy participants. Nonetheless, studying people with these injuries can provide great insight into human psychology (e.g., if we learn that damage to a particular region of the brain interferes with emotions, we may be able to develop treatments for emotional irregularities). In addition to brain injuries, there are numerous other areas of research that could be useful in understanding the human mind but which pose challenges to a true experimental design—such as the experiences of war, long-term isolation, abusive parenting, or prolonged drug use. However, none of these are conditions we could ethically experimentally manipulate and randomly assign people to. Therefore, ethical considerations are another crucial factor in determining an appropriate research design.
Research Methods: Why You Need Them
Just look at any major news outlet and you’ll find research routinely being reported. Sometimes the journalist understands the research methodology, sometimes not (e.g., correlational evidence is often incorrectly represented as causal evidence). Often, the media are quick to draw a conclusion for you. After reading this module, you should recognize that the strength of a scientific finding lies in the strength of its methodology. Therefore, in order to be a savvy consumer of research, you need to understand the pros and cons of different methods and the distinctions among them. Plus, understanding how psychologists systematically go about answering research questions will help you to solve problems in other domains, both personal and professional, not just in psychology.
Outside Resources
- Article: A meta-analysis of research on combating mis-information
- http://journals.sagepub.com/doi/full/10.1177/0956797617714579
- Article: Fixing the Problem of Liberal Bias in Social Psychology
- https://www.scientificamerican.com/article/fixing-the-problem-of-liberal-bias-in-social-psychology/
- Article: Flat out science rejection is rare, but motivated rejection of key scientific claims is relatively common.
- https://blogs.scientificamerican.com/guest-blog/who-are-you-calling-anti-science/
- Article: How Anecdotal Evidence Can Undermine Scientific Results
- https://www.scientificamerican.com/article/how-anecdotal-evidence-can-undermine-scientific-results/
- Article: How fake news is affecting your memory
- http://www.nature.com/news/how-facebook-fake-news-and-friends-are-warping-your-memory-1.21596
- Article: New Study Indicates Existence of Eight Conservative Social Psychologists
- https://heterodoxacademy.org/2016/01/07/new-study-finds-conservative-social-psychologists/
- Article: The Objectivity Thing (or, Why Science Is a Team Sport).
- https://blogs.scientificamerican.com/doing-good-science/httpblogsscientificamericancomdoing-good-science20110720the-objectivity-thing-or-why-science-is-a-team-sport/
- Article: Thomas Kuhn: the man who changed the way the world looked at science
- https://www.theguardian.com/science/2012/aug/19/thomas-kuhn-structure-scientific-revolutions
-
- Article: Harker and Keltner study of yearbook photographs and marriage
- http://psycnet.apa.org/journals/psp/80/1/112/
- Article: Rich Lucas’s longitudinal study on the effects of marriage on happiness
- http://psycnet.apa.org/journals/psp/84/3/527/
- Article: Spending money on others promotes happiness. Elizabeth Dunn’s research
- https://www.sciencemag.org/content/319/5870/1687.abstract
- Article: What makes a life good?
- http://psycnet.apa.org/journals/psp/75/1/156/
Vocabulary
- Anecdotal evidence
- A piece of biased evidence, usually drawn from personal experience, used to support a conclusion that may or may not be correct.
- Causality
- In research, the determination that one variable causes—is responsible for—an effect.
- Correlation
- In statistics, the measure of relatedness of two or more variables.
- Data (also called observations)
- In research, information systematically collected for analysis and interpretation.
- Deductive reasoning
- A form of reasoning in which a given premise determines the interpretation of specific observations (e.g., All birds have feathers; since a duck is a bird, it has feathers).
- Distribution
- In statistics, the relative frequency that a particular value occurs for each possible value of a given variable.
- Empirical
- Concerned with observation and/or the ability to verify a claim.
- Fact
- Objective information about the world.
- Falsify
- In science, the ability of a claim to be tested and—possibly—refuted; a defining feature of science.
- Generalize
- In research, the degree to which one can extend conclusions drawn from the findings of a study to other groups or situations not included in the study.
- Hypothesis
- A tentative explanation that is subject to testing.
- Induction
- To draw general conclusions from specific observations.
- Inductive reasoning
- A form of reasoning in which a general conclusion is inferred from a set of observations (e.g., noting that “the driver in that car was texting; he just cut me off then ran a red light!” (a specific observation), which leads to the general conclusion that texting while driving is dangerous).
- Levels of analysis
- In science, there are complementary understandings and explanations of phenomena.
- Null-hypothesis significance testing (NHST)
- In statistics, a test created to determine the chances that an alternative hypothesis would produce a result as extreme as the one observed if the null hypothesis were actually true.
- Objective
- Being free of personal bias.
- Population
- In research, all the people belonging to a particular group (e.g., the population of left handed people).
- Probability
- A measure of the degree of certainty of the occurrence of an event.
- Probability values
- In statistics, the established threshold for determining whether a given value occurs by chance.
- Pseudoscience
- Beliefs or practices that are presented as being scientific, or which are mistaken for being scientific, but which are not scientific (e.g., astrology, the use of celestial bodies to make predictions about human behaviors, and which presents itself as founded in astronomy, the actual scientific study of celestial objects. Astrology is a pseudoscience unable to be falsified, whereas astronomy is a legitimate scientific discipline).
- Representative
- In research, the degree to which a sample is a typical example of the population from which it is drawn.
- Sample
- In research, a number of people selected from a population to serve as an example of that population.
- Scientific theory
- An explanation for observed phenomena that is empirically well-supported, consistent, and fruitful (predictive).
- Type I error
- In statistics, the error of rejecting the null hypothesis when it is true.
- Type II error
- In statistics, the error of failing to reject the null hypothesis when it is false.
- Value
- Belief about the way things should be.
-
- Confounds
- Factors that undermine the ability to draw causal inferences from an experiment.
- Correlation
- Measures the association between two variables, or how they go together.
- Dependent variable
- The variable the researcher measures but does not manipulate in an experiment.
- Experimenter expectations
- When the experimenter’s expectations influence the outcome of a study.
- Independent variable
- The variable the researcher manipulates and controls in an experiment.
- Longitudinal study
- A study that follows the same group of individuals over time.
- Operational definitions
- How researchers specifically measure a concept.
- Participant demand
- When participants behave in a way that they think the experimenter wants them to behave.
- Placebo effect
- When receiving special treatment or something new affects human behavior.
- Quasi-experimental design
- An experiment that does not require random assignment to conditions.
- Random assignment
- Assigning participants to receive different conditions of an experiment by chance.
References
- Kuhn, T. S. (2012). The structure of scientific revolutions: 50th anniversary edition. Chicago, USA: University of Chicago Press.
- Kuhn, T. S. (2011). Objectivity, value judgment, and theory choice, in T. S. Kuhn (Ed.), The essential tension: Selected studies in scientific tradition and change (pp. 320-339). Chicago: University of Chicago Press. Retrieved from http://ebookcentral.proquest.com
- Chiao, J. (2009). Culture–gene coevolution of individualism – collectivism and the serotonin transporter gene. Proceedings of the Royal Society B, 277, 529-537. doi: 10.1098/rspb.2009.1650
- Dunn, E. W., Aknin, L. B., & Norton, M. I. (2008). Spending money on others promotes happiness. Science, 319(5870), 1687–1688. doi:10.1126/science.1150952
- Festinger, L., Riecken, H.W., & Schachter, S. (1956). When prophecy fails. Minneapolis, MN: University of Minnesota Press.
- Harker, L. A., & Keltner, D. (2001). Expressions of positive emotion in women\’s college yearbook pictures and their relationship to personality and life outcomes across adulthood. Journal of Personality and Social Psychology, 80, 112–124.
- King, L. A., & Napa, C. K. (1998). What makes a life good? Journal of Personality and Social Psychology, 75, 156–165.
- Lucas, R. E., Clark, A. E., Georgellis, Y., & Diener, E. (2003). Re-examining adaptation and the setpoint model of happiness: Reactions to changes in marital status. Journal of Personality and Social Psychology, 84, 527–539.
Authors

Erin I. Smith is Associate Professor of Psychology at California Baptist University. She earned her PhD in Developmental Psychology at the University of California, Riverside. She was recently a visiting scholar in science and religion with SCIO (Scholarship and Christianity in Oxford) and currently serves as the director for the Center for the Study of Human Behavior at CBU.

Christie Napa Scollon is an associate professor of psychology at Singapore Management University. She earned her Ph.D. in social/personality psychology from the University of Illinois at Urbana-Champaign. She holds bachelor’s and master’s degrees in psychology from Southern Methodist University. Her research focuses on cultural differences in emotions and life satisfaction.


 Research Designs by Christie Napa Scollon is licensed under a Creative Commons Attribution-NonCommercial-ShareAlike 4.0 International License. Permissions beyond the scope of this license may be available in our Licensing Agreement.
Creative Commons License
Thinking like a Psychological Scientist by Erin I. Smith is licensed under a Creative Commons Attribution-NonCommercial-ShareAlike 4.0 International License. Permissions beyond the scope of this license may be available in our Licensing Agreement.

