Contents
- 1 Conducting Psychology Research in the Real World
- 2 Introduction
- 3 Rationale for Conducting Psychology Research in the Real World
- 4 An Overview of Research Methods for Studying Daily Life
- 5 Conclusion
- 6 Statistical Thinking
- 7 Introduction
- 8 Distributional Thinking
- 9 Statistical Significance
- 10 Generalizability
- 11 Cause and Effect Conclusions
- 12 Conclusion
Conducting Psychology Research in the Real World
University of Arizona
Because of its ability to determine cause-and-effect relationships, the laboratory experiment is traditionally considered the method of choice for psychological science. One downside, however, is that as it carefully controls conditions and their effects, it can yield findings that are out of touch with reality and have limited use when trying to understand real-world behavior. This module highlights the importance of also conducting research outside the psychology laboratory, within participants’ natural, everyday environments, and reviews existing methodologies for studying daily life
Learning Objectives
- Identify limitations of the traditional laboratory experiment.
- Explain ways in which daily life research can further psychological science.
- Know what methods exist for conducting psychological research in the real world.
Introduction
The laboratory experiment is traditionally considered the “gold standard” in psychology research. This is because only laboratory experiments can clearly separate cause from effect and therefore establish causality. Despite this unique strength, it is also clear that a scientific field that is mainly based on controlled laboratory studies ends up lopsided. Specifically, it accumulates a lot of knowledge on what can happen—under carefully isolated and controlled circumstances—but it has little to say about what actually does happen under the circumstances that people actually encounter in their daily lives.

For example, imagine you are a participant in an experiment that looks at the effect of being in a good mood on generosity, a topic that may have a good deal of practical application. Researchers create an internally-valid, carefully-controlled experiment where they randomly assign you to watch either a happy movie or a neutral movie, and then you are given the opportunity to help the researcher out by staying longer and participating in another study. If people in a good mood are more willing to stay and help out, the researchers can feel confident that – since everything else was held constant – your positive mood led you to be more helpful. However, what does this tell us about helping behaviors in the real world? Does it generalize to other kinds of helping, such as donating money to a charitable cause? Would all kinds of happy movies produce this behavior, or only this one? What about other positive experiences that might boost mood, like receiving a compliment or a good grade? And what if you were watching the movie with friends, in a crowded theatre, rather than in a sterile research lab? Taking research out into the real world can help answer some of these sorts of important questions.
As one of the founding fathers of social psychology remarked, “Experimentation in the laboratory occurs, socially speaking, on an island quite isolated from the life of society” (Lewin, 1944, p. 286). This module highlights the importance of going beyond experimentation and also conducting research outside the laboratory (Reis & Gosling, 2010), directly within participants’ natural environments, and reviews existing methodologies for studying daily life.
Rationale for Conducting Psychology Research in the Real World
One important challenge researchers face when designing a study is to find the right balance between ensuring internal validity, or the degree to which a study allows unambiguous causal inferences, and external validity, or the degree to which a study ensures that potential findings apply to settings and samples other than the ones being studied (Brewer, 2000). Unfortunately, these two kinds of validity tend to be difficult to achieve at the same time, in one study. This is because creating a controlled setting, in which all potentially influential factors (other than the experimentally-manipulated variable) are controlled, is bound to create an environment that is quite different from what people naturally encounter (e.g., using a happy movie clip to promote helpful behavior). However, it is the degree to which an experimental situation is comparable to the corresponding real-world situation of interest that determines how generalizable potential findings will be. In other words, if an experiment is very far-off from what a person might normally experience in everyday life, you might reasonably question just how useful its findings are.
Because of the incompatibility of the two types of validity, one is often—by design—prioritized over the other. Due to the importance of identifying true causal relationships, psychology has traditionally emphasized internal over external validity. However, in order to make claims about human behavior that apply across populations and environments, researchers complement traditional laboratory research, where participants are brought into the lab, with field research where, in essence, the psychological laboratory is brought to participants. Field studies allow for the important test of how psychological variables and processes of interest “behave” under real-world circumstances (i.e., what actually does happen rather than what can happen). They can also facilitate “downstream” operationalizations of constructs that measure life outcomes of interest directly rather than indirectly.
Take, for example, the fascinating field of psychoneuroimmunology, where the goal is to understand the interplay of psychological factors – such as personality traits or one’s stress level – and the immune system. Highly sophisticated and carefully controlled experiments offer ways to isolate the variety of neural, hormonal, and cellular mechanisms that link psychological variables such as chronic stress to biological outcomes such as immunosuppression (a state of impaired immune functioning; Sapolsky, 2004). Although these studies demonstrate impressively how psychological factors can affect health-relevant biological processes, they—because of their research design—remain mute about the degree to which these factors actually do undermine people’s everyday health in real life. It is certainly important to show that laboratory stress can alter the number of natural killer cells in the blood. But it is equally important to test to what extent the levels of stress that people experience on a day-to-day basis result in them catching a cold more often or taking longer to recover from one. The goal for researchers, therefore, must be to complement traditional laboratory experiments with less controlled studies under real-world circumstances. The term ecological validity is used to refer the degree to which an effect has been obtained under conditions that are typical for what happens in everyday life (Brewer, 2000). In this example, then, people might keep a careful daily log of how much stress they are under as well as noting physical symptoms such as headaches or nausea. Although many factors beyond stress level may be responsible for these symptoms, this more correlational approach can shed light on how the relationship between stress and health plays out outside of the laboratory.
An Overview of Research Methods for Studying Daily Life
Capturing “life as it is lived” has been a strong goal for some researchers for a long time. Wilhelm and his colleagues recently published a comprehensive review of early attempts to systematically document daily life (Wilhelm, Perrez, & Pawlik, 2012). Building onto these original methods, researchers have, over the past decades, developed a broad toolbox for measuring experiences, behavior, and physiology directly in participants’ daily lives (Mehl & Conner, 2012). Figure 1 provides a schematic overview of the methodologies described below.

Studying Daily Experiences
Starting in the mid-1970s, motivated by a growing skepticism toward highly-controlled laboratory studies, a few groups of researchers developed a set of new methods that are now commonly known as the experience-sampling method (Hektner, Schmidt, & Csikszentmihalyi, 2007), ecological momentary assessment (Stone & Shiffman, 1994), or the diary method (Bolger & Rafaeli, 2003). Although variations within this set of methods exist, the basic idea behind all of them is to collect in-the-moment (or, close-to-the-moment) self-report data directly from people as they go about their daily lives. This is typically accomplished by asking participants’ repeatedly (e.g., five times per day) over a period of time (e.g., a week) to report on their current thoughts and feelings. The momentary questionnaires often ask about their location (e.g., “Where are you now?”), social environment (e.g., “With whom are you now?”), activity (e.g., “What are you currently doing?”), and experiences (e.g., “How are you feeling?”). That way, researchers get a snapshot of what was going on in participants’ lives at the time at which they were asked to report.
Technology has made this sort of research possible, and recent technological advances have altered the different tools researchers are able to easily use. Initially, participants wore electronic wristwatches that beeped at preprogrammed but seemingly random times, at which they completed one of a stack of provided paper questionnaires. With the mobile computing revolution, both the prompting and the questionnaire completion were gradually replaced by handheld devices such as smartphones. Being able to collect the momentary questionnaires digitally and time-stamped (i.e., having a record of exactly when participants responded) had major methodological and practical advantages and contributed to experience sampling going mainstream (Conner, Tennen, Fleeson, & Barrett, 2009).

Over time, experience sampling and related momentary self-report methods have become very popular, and, by now, they are effectively the gold standard for studying daily life. They have helped make progress in almost all areas of psychology (Mehl & Conner, 2012). These methods ensure receiving many measurements from many participants, and has further inspired the development of novel statistical methods (Bolger & Laurenceau, 2013). Finally, and maybe most importantly, they accomplished what they sought out to accomplish: to bring attention to what psychology ultimately wants and needs to know about, namely “what people actually do, think, and feel in the various contexts of their lives” (Funder, 2001, p. 213). In short, these approaches have allowed researchers to do research that is more externally valid, or more generalizable to real life, than the traditional laboratory experiment.
To illustrate these techniques, consider a classic study, Stone, Reed, and Neale (1987), who tracked positive and negative experiences surrounding a respiratory infection using daily experience sampling. They found that undesirable experiences peaked and desirable ones dipped about four to five days prior to participants coming down with the cold. More recently, Killingsworth and Gilbert (2010) collected momentary self-reports from more than 2,000 participants via a smartphone app. They found that participants were less happy when their mind was in an idling, mind-wandering state, such as surfing the Internet or multitasking at work, than when it was in an engaged, task-focused one, such as working diligently on a paper. These are just two examples that illustrate how experience-sampling studies have yielded findings that could not be obtained with traditional laboratory methods.
Recently, the day reconstruction method (DRM) (Kahneman, Krueger, Schkade, Schwarz, & Stone, 2004) has been developed to obtain information about a person’s daily experiences without going through the burden of collecting momentary experience-sampling data. In the DRM, participants report their experiences of a given day retrospectively after engaging in a systematic, experiential reconstruction of the day on the following day. As a participant in this type of study, you might look back on yesterday, divide it up into a series of episodes such as “made breakfast,” “drove to work,” “had a meeting,” etc. You might then report who you were with in each episode and how you felt in each. This approach has shed light on what situations lead to moments of positive and negative mood throughout the course of a normal day.
Studying Daily Behavior
Experience sampling is often used to study everyday behavior (i.e., daily social interactions and activities). In the laboratory, behavior is best studied using direct behavioral observation (e.g., video recordings). In the real world, this is, of course, much more difficult. As Funder put it, it seems it would require a “detective’s report [that] would specify in exact detail everything the participant said and did, and with whom, in all of the contexts of the participant’s life” (Funder, 2007, p. 41).
As difficult as this may seem, Mehl and colleagues have developed a naturalistic observation methodology that is similar in spirit. Rather than following participants—like a detective—with a video camera (see Craik, 2000), they equip participants with a portable audio recorder that is programmed to periodically record brief snippets of ambient sounds (e.g., 30 seconds every 12 minutes). Participants carry the recorder (originally a microcassette recorder, now a smartphone app) on them as they go about their days and return it at the end of the study. The recorder provides researchers with a series of sound bites that, together, amount to an acoustic diary of participants’ days as they naturally unfold—and that constitute a representative sample of their daily activities and social encounters. Because it is somewhat similar to having the researcher’s ear at the participant’s lapel, they called their method the electronically activated recorder, or EAR (Mehl, Pennebaker, Crow, Dabbs, & Price, 2001). The ambient sound recordings can be coded for many things, including participants’ locations (e.g., at school, in a coffee shop), activities (e.g., watching TV, eating), interactions (e.g., in a group, on the phone), and emotional expressions (e.g., laughing, sighing). As unnatural or intrusive as it might seem, participants report that they quickly grow accustomed to the EAR and say they soon find themselves behaving as they normally would.
In a cross-cultural study, Ramírez-Esparza and her colleagues used the EAR method to study sociability in the United States and Mexico. Interestingly, they found that although American participants rated themselves significantly higher than Mexicans on the question, “I see myself as a person who is talkative,” they actually spent almost 10 percent less time talking than Mexicans did (Ramírez-Esparza, Mehl, Álvarez Bermúdez, & Pennebaker, 2009). In a similar way, Mehl and his colleagues used the EAR method to debunk the long-standing myth that women are considerably more talkative than men. Using data from six different studies, they showed that both sexes use on average about 16,000 words per day. The estimated sex difference of 546 words was trivial compared to the immense range of more than 46,000 words between the least and most talkative individual (695 versus 47,016 words; Mehl, Vazire, Ramírez-Esparza, Slatcher, & Pennebaker, 2007). Together, these studies demonstrate how naturalistic observation can be used to study objective aspects of daily behavior and how it can yield findings quite different from what other methods yield (Mehl, Robbins, & Deters, 2012).
A series of other methods and creative ways for assessing behavior directly and unobtrusively in the real world are described in a seminal book on real-world, subtle measures (Webb, Campbell, Schwartz, Sechrest, & Grove, 1981). For example, researchers have used time-lapse photography to study the flow of people and the use of space in urban public places (Whyte, 1980). More recently, they have observed people’s personal (e.g., dorm rooms) and professional (e.g., offices) spaces to understand how personality is expressed and detected in everyday environments (Gosling, Ko, Mannarelli, & Morris, 2002). They have even systematically collected and analyzed people’s garbage to measure what people actually consume (e.g., empty alcohol bottles or cigarette boxes) rather than what they say they consume (Rathje & Murphy, 2001). Because people often cannot and sometimes may not want to accurately report what they do, the direct—and ideally nonreactive—assessment of real-world behavior is of high importance for psychological research (Baumeister, Vohs, & Funder, 2007).
Studying Daily Physiology
In addition to studying how people think, feel, and behave in the real world, researchers are also interested in how our bodies respond to the fluctuating demands of our lives. What are the daily experiences that make our “blood boil”? How do our neurotransmitters and hormones respond to the stressors we encounter in our lives? What physiological reactions do we show to being loved—or getting ostracized? You can see how studying these powerful experiences in real life, as they actually happen, may provide more rich and informative data than one might obtain in an artificial laboratory setting that merely mimics these experiences.

Also, in pursuing these questions, it is important to keep in mind that what is stressful, engaging, or boring for one person might not be so for another. It is, in part, for this reason that researchers have found only limited correspondence between how people respond physiologically to a standardized laboratory stressor (e.g., giving a speech) and how they respond to stressful experiences in their lives. To give an example, Wilhelm and Grossman (2010) describe a participant who showed rather minimal heart rate increases in response to a laboratory stressor (about five to 10 beats per minute) but quite dramatic increases (almost 50 beats per minute) later in the afternoon while watching a soccer game. Of course, the reverse pattern can happen as well, such as when patients have high blood pressure in the doctor’s office but not in their home environment—the so-called white coat hypertension (White, Schulman, McCabe, & Dey, 1989).
Ambulatory physiological monitoring – that is, monitoring physiological reactions as people go about their daily lives – has a long history in biomedical research and an array of monitoring devices exist (Fahrenberg & Myrtek, 1996). Among the biological signals that can now be measured in daily life with portable signal recording devices are the electrocardiogram (ECG), blood pressure, electrodermal activity (or “sweat response”), body temperature, and even the electroencephalogram (EEG) (Wilhelm & Grossman, 2010). Most recently, researchers have added ambulatory assessment of hormones (e.g., cortisol) and other biomarkers (e.g., immune markers) to the list (Schlotz, 2012). The development of ever more sophisticated ways to track what goes on underneath our skins as we go about our lives is a fascinating and rapidly advancing field.
In a recent study, Lane, Zareba, Reis, Peterson, and Moss (2011) used experience sampling combined with ambulatory electrocardiography (a so-called Holter monitor) to study how emotional experiences can alter cardiac function in patients with a congenital heart abnormality (e.g., long QT syndrome). Consistent with the idea that emotions may, in some cases, be able to trigger a cardiac event, they found that typical—in most cases even relatively low intensity— daily emotions had a measurable effect on ventricular repolarization, an important cardiac indicator that, in these patients, is linked to risk of a cardiac event. In another study, Smyth and colleagues (1998) combined experience sampling with momentary assessment of cortisol, a stress hormone. They found that momentary reports of current or even anticipated stress predicted increased cortisol secretion 20 minutes later. Further, and independent of that, the experience of other kinds of negative affect (e.g., anger, frustration) also predicted higher levels of cortisol and the experience of positive affect (e.g., happy, joyful) predicted lower levels of this important stress hormone. Taken together, these studies illustrate how researchers can use ambulatory physiological monitoring to study how the little—and seemingly trivial or inconsequential—experiences in our lives leave objective, measurable traces in our bodily systems.
Studying Online Behavior
Another domain of daily life that has only recently emerged is virtual daily behavior or how people act and interact with others on the Internet. Irrespective of whether social media will turn out to be humanity’s blessing or curse (both scientists and laypeople are currently divided over this question), the fact is that people are spending an ever increasing amount of time online. In light of that, researchers are beginning to think of virtual behavior as being as serious as “actual” behavior and seek to make it a legitimate target of their investigations (Gosling & Johnson, 2010).
\".")
One way to study virtual behavior is to make use of the fact that most of what people do on the Web—emailing, chatting, tweeting, blogging, posting— leaves direct (and permanent) verbal traces. For example, differences in the ways in which people use words (e.g., subtle preferences in word choice) have been found to carry a lot of psychological information (Pennebaker, Mehl, & Niederhoffer, 2003). Therefore, a good way to study virtual social behavior is to study virtual language behavior. Researchers can download people’s—often public—verbal expressions and communications and analyze them using modern text analysis programs (e.g., Pennebaker, Booth, & Francis, 2007).
For example, Cohn, Mehl, and Pennebaker (2004) downloaded blogs of more than a thousand users of lifejournal.com, one of the first Internet blogging sites, to study how people responded socially and emotionally to the attacks of September 11, 2001. In going “the online route,” they could bypass a critical limitation of coping research, the inability to obtain baseline information; that is, how people were doing before the traumatic event occurred. Through access to the database of public blogs, they downloaded entries from two months prior to two months after the attacks. Their linguistic analyses revealed that in the first days after the attacks, participants expectedly expressed more negative emotions and were more cognitively and socially engaged, asking questions and sending messages of support. Already after two weeks, though, their moods and social engagement returned to baseline, and, interestingly, their use of cognitive-analytic words (e.g., “think,” “question”) even dropped below their normal level. Over the next six weeks, their mood hovered around their pre-9/11 baseline, but both their social engagement and cognitive-analytic processing stayed remarkably low. This suggests a social and cognitive weariness in the aftermath of the attacks. In using virtual verbal behavior as a marker of psychological functioning, this study was able to draw a fine timeline of how humans cope with disasters.
Reflecting their rapidly growing real-world importance, researchers are now beginning to investigate behavior on social networking sites such as Facebook (Wilson, Gosling, & Graham, 2012). Most research looks at psychological correlates of online behavior such as personality traits and the quality of one’s social life but, importantly, there are also first attempts to export traditional experimental research designs into an online setting. In a pioneering study of online social influence, Bond and colleagues (2012) experimentally tested the effects that peer feedback has on voting behavior. Remarkably, their sample consisted of 16 million (!) Facebook users. They found that online political-mobilization messages (e.g., “I voted” accompanied by selected pictures of their Facebook friends) influenced real-world voting behavior. This was true not just for users who saw the messages but also for their friends and friends of their friends. Although the intervention effect on a single user was very small, through the enormous number of users and indirect social contagion effects, it resulted cumulatively in an estimated 340,000 additional votes—enough to tilt a close election. In short, although still in its infancy, research on virtual daily behavior is bound to change social science, and it has already helped us better understand both virtual and “actual” behavior.
“Smartphone Psychology”?
A review of research methods for studying daily life would not be complete without a vision of “what’s next.” Given how common they have become, it is safe to predict that smartphones will not just remain devices for everyday online communication but will also become devices for scientific data collection and intervention (Kaplan & Stone, 2013; Yarkoni, 2012). These devices automatically store vast amounts of real-world user interaction data, and, in addition, they are equipped with sensors to track the physical (e. g., location, position) and social (e.g., wireless connections around the phone) context of these interactions. Miller (2012, p. 234) states, “The question is not whether smartphones will revolutionize psychology but how, when, and where the revolution will happen.” Obviously, their immense potential for data collection also brings with it big new challenges for researchers (e.g., privacy protection, data analysis, and synthesis). Yet it is clear that many of the methods described in this module—and many still to be developed ways of collecting real-world data—will, in the future, become integrated into the devices that people naturally and happily carry with them from the moment they get up in the morning to the moment they go to bed.
Conclusion
This module sought to make a case for psychology research conducted outside the lab. If the ultimate goal of the social and behavioral sciences is to explain human behavior, then researchers must also—in addition to conducting carefully controlled lab studies—deal with the “messy” real world and find ways to capture life as it naturally happens.
Mortensen and Cialdini (2010) refer to the dynamic give-and-take between laboratory and field research as “full-cycle psychology”. Going full cycle, they suggest, means that “researchers use naturalistic observation to determine an effect’s presence in the real world, theory to determine what processes underlie the effect, experimentation to verify the effect and its underlying processes, and a return to the natural environment to corroborate the experimental findings” (Mortensen & Cialdini, 2010, p. 53). To accomplish this, researchers have access to a toolbox of research methods for studying daily life that is now more diverse and more versatile than it has ever been before. So, all it takes is to go ahead and—literally—bring science to life.
Statistical Thinking
By Beth Chance and Allan Rossman
California Polytechnic State University, San Luis Obispo
As our society increasingly calls for evidence-based decision making, it is important to consider how and when we can draw valid inferences from data. This module will use four recent research studies to highlight key elements of a statistical investigation.
Learning Objectives
- Define basic elements of a statistical investigation.
- Describe the role of p-values and confidence intervals in statistical inference.
- Describe the role of random sampling in generalizing conclusions from a sample to a population.
- Describe the role of random assignment in drawing cause-and-effect conclusions.
- Critique statistical studies.
Introduction
Does drinking coffee actually increase your life expectancy? A recent study (Freedman, Park, Abnet, Hollenbeck, & Sinha, 2012) found that men who drank at least six cups of coffee a day had a 10% lower chance of dying (women 15% lower) than those who drank none. Does this mean you should pick up or increase your own coffee habit?
Modern society has become awash in studies such as this; you can read about several such studies in the news every day. Moreover, data abound everywhere in modern life. Conducting such a study well, and interpreting the results of such studies well for making informed decisions or setting policies, requires understanding basic ideas of statistics, the science of gaining insight from data. Rather than relying on anecdote and intuition, statistics allows us to systematically study phenomena of interest.

Key components to a statistical investigation are:
- Planning the study: Start by asking a testable research question and deciding how to collect data. For example, how long was the study period of the coffee study? How many people were recruited for the study, how were they recruited, and from where? How old were they? What other variables were recorded about the individuals, such as smoking habits, on the comprehensive lifestyle questionnaires? Were changes made to the participants’ coffee habits during the course of the study?
- Examining the data: What are appropriate ways to examine the data? What graphs are relevant, and what do they reveal? What descriptive statistics can be calculated to summarize relevant aspects of the data, and what do they reveal? What patterns do you see in the data? Are there any individual observations that deviate from the overall pattern, and what do they reveal? For example, in the coffee study, did the proportions differ when we compared the smokers to the non-smokers?
- Inferring from the data: What are valid statistical methods for drawing inferences “beyond” the data you collected? In the coffee study, is the 10%–15% reduction in risk of death something that could have happened just by chance?
- Drawing conclusions: Based on what you learned from your data, what conclusions can you draw? Who do you think these conclusions apply to? (Were the people in the coffee study older? Healthy? Living in cities?) Can you draw a cause-and-effect conclusion about your treatments? (Are scientists now saying that the coffee drinking is the cause of the decreased risk of death?)
Notice that the numerical analysis (“crunching numbers” on the computer) comprises only a small part of overall statistical investigation. In this module, you will see how we can answer some of these questions and what questions you should be asking about any statistical investigation you read about.
Distributional Thinking
When data are collected to address a particular question, an important first step is to think of meaningful ways to organize and examine the data. The most fundamental principle of statistics is that data vary. The pattern of that variation is crucial to capture and to understand. Often, careful presentation of the data will address many of the research questions without requiring more sophisticated analyses. It may, however, point to additional questions that need to be examined in more detail.
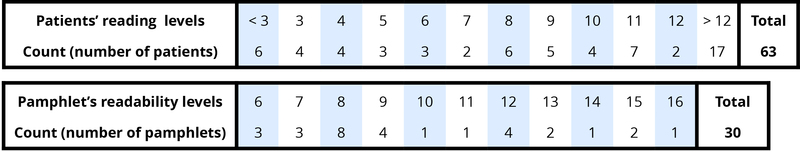
Example 1: Researchers investigated whether cancer pamphlets are written at an appropriate level to be read and understood by cancer patients (Short, Moriarty, & Cooley, 1995). Tests of reading ability were given to 63 patients. In addition, readability level was determined for a sample of 30 pamphlets, based on characteristics such as the lengths of words and sentences in the pamphlet. The results, reported in terms of grade levels, are displayed in Table 1.
These two variables reveal two fundamental aspects of statistical thinking:
- Data vary. More specifically, values of a variable (such as reading level of a cancer patient or readability level of a cancer pamphlet) vary.
- Analyzing the pattern of variation, called the distribution of the variable, often reveals insights.
Addressing the research question of whether the cancer pamphlets are written at appropriate levels for the cancer patients requires comparing the two distributions. A naïve comparison might focus only on the centers of the distributions. Both medians turn out to be ninth grade, but considering only medians ignores the variability and the overall distributions of these data. A more illuminating approach is to compare the entire distributions, for example with a graph, as in Figure 1.
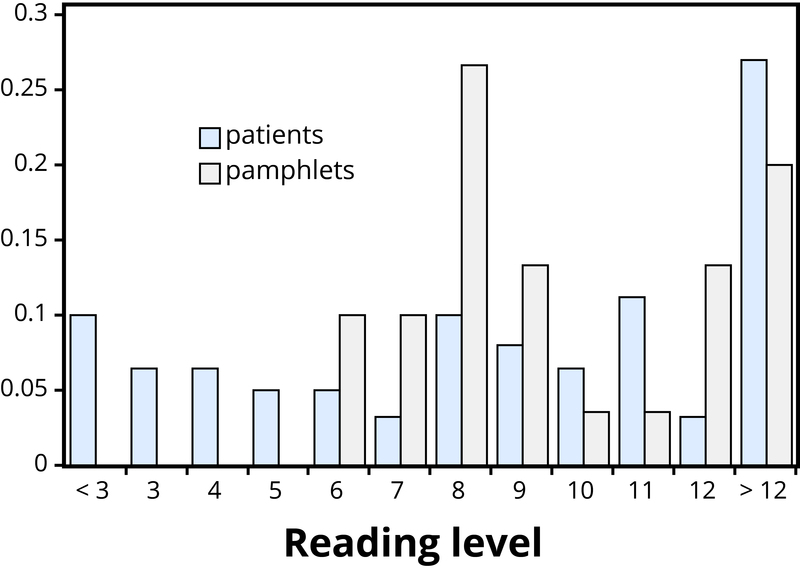
Figure 1 makes clear that the two distributions are not well aligned at all. The most glaring discrepancy is that many patients (17/63, or 27%, to be precise) have a reading level below that of the most readable pamphlet. These patients will need help to understand the information provided in the cancer pamphlets. Notice that this conclusion follows from considering the distributions as a whole, not simply measures of center or variability, and that the graph contrasts those distributions more immediately than the frequency tables.
Statistical Significance
Even when we find patterns in data, often there is still uncertainty in various aspects of the data. For example, there may be potential for measurement errors (even your own body temperature can fluctuate by almost 1 °F over the course of the day). Or we may only have a “snapshot” of observations from a more long-term process or only a small subset of individuals from the population of interest. In such cases, how can we determine whether patterns we see in our small set of data is convincing evidence of a systematic phenomenon in the larger process or population?
Example 2: In a study reported in the November 2007 issue of Nature, researchers investigated whether pre-verbal infants take into account an individual’s actions toward others in evaluating that individual as appealing or aversive (Hamlin, Wynn, & Bloom, 2007). In one component of the study, 10-month-old infants were shown a “climber” character (a piece of wood with “googly” eyes glued onto it) that could not make it up a hill in two tries. Then the infants were shown two scenarios for the climber’s next try, one where the climber was pushed to the top of the hill by another character (“helper”), and one where the climber was pushed back down the hill by another character (“hinderer”). The infant was alternately shown these two scenarios several times. Then the infant was presented with two pieces of wood (representing the helper and the hinderer characters) and asked to pick one to play with. The researchers found that of the 16 infants who made a clear choice, 14 chose to play with the helper toy.

One possible explanation for this clear majority result is that the helping behavior of the one toy increases the infants’ likelihood of choosing that toy. But are there other possible explanations? What about the color of the toy? Well, prior to collecting the data, the researchers arranged so that each color and shape (red square and blue circle) would be seen by the same number of infants. Or maybe the infants had right-handed tendencies and so picked whichever toy was closer to their right hand? Well, prior to collecting the data, the researchers arranged it so half the infants saw the helper toy on the right and half on the left. Or, maybe the shapes of these wooden characters (square, triangle, circle) had an effect? Perhaps, but again, the researchers controlled for this by rotating which shape was the helper toy, the hinderer toy, and the climber. When designing experiments, it is important to control for as many variables as might affect the responses as possible.
It is beginning to appear that the researchers accounted for all the other plausible explanations. But there is one more important consideration that cannot be controlled—if we did the study again with these 16 infants, they might not make the same choices. In other words, there is some randomness inherent in their selection process. Maybe each infant had no genuine preference at all, and it was simply “random luck” that led to 14 infants picking the helper toy. Although this random component cannot be controlled, we can apply a probability model to investigate the pattern of results that would occur in the long run if random chance were the only factor.
If the infants were equally likely to pick between the two toys, then each infant had a 50% chance of picking the helper toy. It’s like each infant tossed a coin, and if it landed heads, the infant picked the helper toy. So if we tossed a coin 16 times, could it land heads 14 times? Sure, it’s possible, but it turns out to be very unlikely. Getting 14 (or more) heads in 16 tosses is about as likely as tossing a coin and getting 9 heads in a row. This probability is referred to as a p-value. The p-value tells you how often a random process would give a result at least as extreme as what was found in the actual study, assuming there was nothing other than random chance at play. So, if we assume that each infant was choosing equally, then the probability that 14 or more out of 16 infants would choose the helper toy is found to be 0.0021. We have only two logical possibilities: either the infants have a genuine preference for the helper toy, or the infants have no preference (50/50) and an outcome that would occur only 2 times in 1,000 iterations happened in this study. Because this p-value of 0.0021 is quite small, we conclude that the study provides very strong evidence that these infants have a genuine preference for the helper toy. We often compare the p-value to some cut-off value (called the level of significance, typically around 0.05). If the p-value is smaller than that cut-off value, then we reject the hypothesis that only random chance was at play here. In this case, these researchers would conclude that significantly more than half of the infants in the study chose the helper toy, giving strong evidence of a genuine preference for the toy with the helping behavior.
Generalizability

One limitation to the previous study is that the conclusion only applies to the 16 infants in the study. We don’t know much about how those 16 infants were selected. Suppose we want to select a subset of individuals (a sample) from a much larger group of individuals (the population) in such a way that conclusions from the sample can be generalized to the larger population. This is the question faced by pollsters every day.
Example 3: The General Social Survey (GSS) is a survey on societal trends conducted every other year in the United States. Based on a sample of about 2,000 adult Americans, researchers make claims about what percentage of the U.S. population consider themselves to be “liberal,” what percentage consider themselves “happy,” what percentage feel “rushed” in their daily lives, and many other issues. The key to making these claims about the larger population of all American adults lies in how the sample is selected. The goal is to select a sample that is representative of the population, and a common way to achieve this goal is to select a random sample that gives every member of the population an equal chance of being selected for the sample. In its simplest form, random sampling involves numbering every member of the population and then using a computer to randomly select the subset to be surveyed. Most polls don’t operate exactly like this, but they do use probability-based sampling methods to select individuals from nationally representative panels.
In 2004, the GSS reported that 817 of 977 respondents (or 83.6%) indicated that they always or sometimes feel rushed. This is a clear majority, but we again need to consider variation due to random sampling. Fortunately, we can use the same probability model we did in the previous example to investigate the probable size of this error. (Note, we can use the coin-tossing model when the actual population size is much, much larger than the sample size, as then we can still consider the probability to be the same for every individual in the sample.) This probability model predicts that the sample result will be within 3 percentage points of the population value (roughly 1 over the square root of the sample size, the margin of error). A statistician would conclude, with 95% confidence, that between 80.6% and 86.6% of all adult Americans in 2004 would have responded that they sometimes or always feel rushed.
The key to the margin of error is that when we use a probability sampling method, we can make claims about how often (in the long run, with repeated random sampling) the sample result would fall within a certain distance from the unknown population value by chance (meaning by random sampling variation) alone. Conversely, non-random samples are often suspect to bias, meaning the sampling method systematically over-represents some segments of the population and under-represents others. We also still need to consider other sources of bias, such as individuals not responding honestly. These sources of error are not measured by the margin of error.
Cause and Effect Conclusions
In many research studies, the primary question of interest concerns differences between groups. Then the question becomes how were the groups formed (e.g., selecting people who already drink coffee vs. those who don’t). In some studies, the researchers actively form the groups themselves. But then we have a similar question—could any differences we observe in the groups be an artifact of that group-formation process? Or maybe the difference we observe in the groups is so large that we can discount a “fluke” in the group-formation process as a reasonable explanation for what we find?
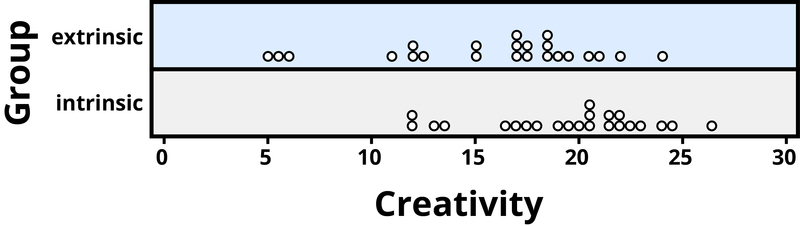
Example 4: A psychology study investigated whether people tend to display more creativity when they are thinking about intrinsic or extrinsic motivations (Ramsey & Schafer, 2002, based on a study by Amabile, 1985). The subjects were 47 people with extensive experience with creative writing. Subjects began by answering survey questions about either intrinsic motivations for writing (such as the pleasure of self-expression) or extrinsic motivations (such as public recognition). Then all subjects were instructed to write a haiku, and those poems were evaluated for creativity by a panel of judges. The researchers conjectured beforehand that subjects who were thinking about intrinsic motivations would display more creativity than subjects who were thinking about extrinsic motivations. The creativity scores from the 47 subjects in this study are displayed in Figure 2, where higher scores indicate more creativity.
In this example, the key question is whether the type of motivation affects creativity scores. In particular, do subjects who were asked about intrinsic motivations tend to have higher creativity scores than subjects who were asked about extrinsic motivations?
Figure 2 reveals that both motivation groups saw considerable variability in creativity scores, and these scores have considerable overlap between the groups. In other words, it’s certainly not always the case that those with extrinsic motivations have higher creativity than those with intrinsic motivations, but there may still be a statistical tendency in this direction. (Psychologist Keith Stanovich (2013) refers to people’s difficulties with thinking about such probabilistic tendencies as “the Achilles heel of human cognition.”)
The mean creativity score is 19.88 for the intrinsic group, compared to 15.74 for the extrinsic group, which supports the researchers’ conjecture. Yet comparing only the means of the two groups fails to consider the variability of creativity scores in the groups. We can measure variability with statistics using, for instance, the standard deviation: 5.25 for the extrinsic group and 4.40 for the intrinsic group. The standard deviations tell us that most of the creativity scores are within about 5 points of the mean score in each group. We see that the mean score for the intrinsic group lies within one standard deviation of the mean score for extrinsic group. So, although there is a tendency for the creativity scores to be higher in the intrinsic group, on average, the difference is not extremely large.
We again want to consider possible explanations for this difference. The study only involved individuals with extensive creative writing experience. Although this limits the population to which we can generalize, it does not explain why the mean creativity score was a bit larger for the intrinsic group than for the extrinsic group. Maybe women tend to receive higher creativity scores? Here is where we need to focus on how the individuals were assigned to the motivation groups. If only women were in the intrinsic motivation group and only men in the extrinsic group, then this would present a problem because we wouldn’t know if the intrinsic group did better because of the different type of motivation or because they were women. However, the researchers guarded against such a problem by randomly assigning the individuals to the motivation groups. Like flipping a coin, each individual was just as likely to be assigned to either type of motivation. Why is this helpful? Because this random assignment tends to balance out all the variables related to creativity we can think of, and even those we don’t think of in advance, between the two groups. So we should have a similar male/female split between the two groups; we should have a similar age distribution between the two groups; we should have a similar distribution of educational background between the two groups; and so on. Random assignment should produce groups that are as similar as possible except for the type of motivation, which presumably eliminates all those other variables as possible explanations for the observed tendency for higher scores in the intrinsic group.
But does this always work? No, so by “luck of the draw” the groups may be a little different prior to answering the motivation survey. So then the question is, is it possible that an unlucky random assignment is responsible for the observed difference in creativity scores between the groups? In other words, suppose each individual’s poem was going to get the same creativity score no matter which group they were assigned to, that the type of motivation in no way impacted their score. Then how often would the random-assignment process alone lead to a difference in mean creativity scores as large (or larger) than 19.88 – 15.74 = 4.14 points?
We again want to apply to a probability model to approximate a p-value, but this time the model will be a bit different. Think of writing everyone’s creativity scores on an index card, shuffling up the index cards, and then dealing out 23 to the extrinsic motivation group and 24 to the intrinsic motivation group, and finding the difference in the group means. We (better yet, the computer) can repeat this process over and over to see how often, when the scores don’t change, random assignment leads to a difference in means at least as large as 4.41. Figure 3 shows the results from 1,000 such hypothetical random assignments for these scores.
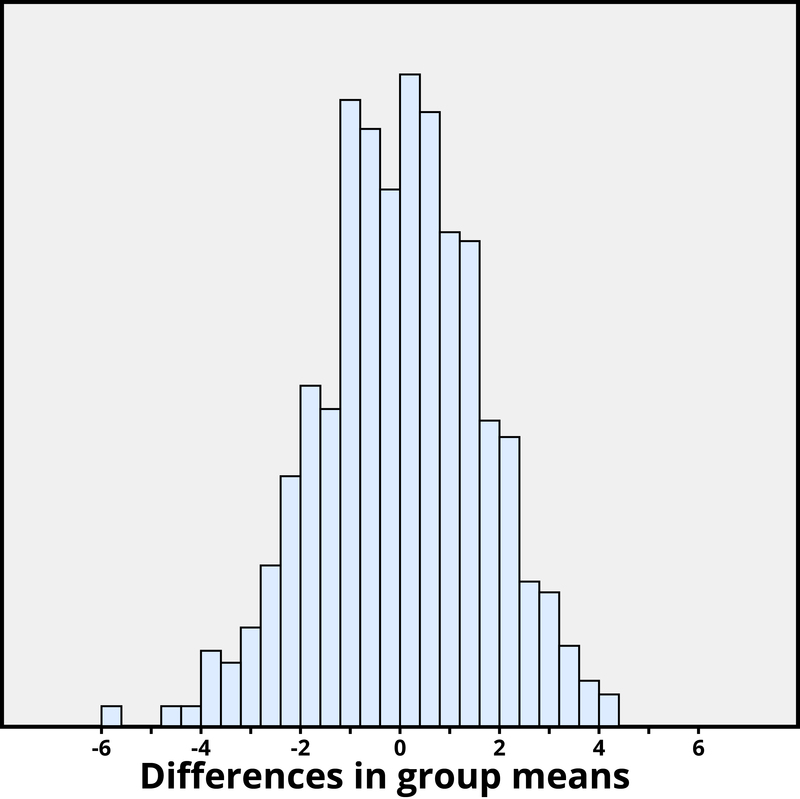
Only 2 of the 1,000 simulated random assignments produced a difference in group means of 4.41 or larger. In other words, the approximate p-value is 2/1000 = 0.002. This small p-value indicates that it would be very surprising for the random assignment process alone to produce such a large difference in group means. Therefore, as with Example 2, we have strong evidence that focusing on intrinsic motivations tends to increase creativity scores, as compared to thinking about extrinsic motivations.
Notice that the previous statement implies a cause-and-effect relationship between motivation and creativity score; is such a strong conclusion justified? Yes, because of the random assignment used in the study. That should have balanced out any other variables between the two groups, so now that the small p-value convinces us that the higher mean in the intrinsic group wasn’t just a coincidence, the only reasonable explanation left is the difference in the type of motivation. Can we generalize this conclusion to everyone? Not necessarily—we could cautiously generalize this conclusion to individuals with extensive experience in creative writing similar the individuals in this study, but we would still want to know more about how these individuals were selected to participate.
Conclusion

Statistical thinking involves the careful design of a study to collect meaningful data to answer a focused research question, detailed analysis of patterns in the data, and drawing conclusions that go beyond the observed data. Random sampling is paramount to generalizing results from our sample to a larger population, and random assignment is key to drawing cause-and-effect conclusions. With both kinds of randomness, probability models help us assess how much random variation we can expect in our results, in order to determine whether our results could happen by chance alone and to estimate a margin of error.
So where does this leave us with regard to the coffee study mentioned at the beginning of this module? We can answer many of the questions:
- This was a 14-year study conducted by researchers at the National Cancer Institute.
- The results were published in the June issue of the New England Journal of Medicine, a respected, peer-reviewed journal.
- The study reviewed coffee habits of more than 402,000 people ages 50 to 71 from six states and two metropolitan areas. Those with cancer, heart disease, and stroke were excluded at the start of the study. Coffee consumption was assessed once at the start of the study.
- About 52,000 people died during the course of the study.
- People who drank between two and five cups of coffee daily showed a lower risk as well, but the amount of reduction increased for those drinking six or more cups.
- The sample sizes were fairly large and so the p-values are quite small, even though percent reduction in risk was not extremely large (dropping from a 12% chance to about 10%–11%).
- Whether coffee was caffeinated or decaffeinated did not appear to affect the results.
- This was an observational study, so no cause-and-effect conclusions can be drawn between coffee drinking and increased longevity, contrary to the impression conveyed by many news headlines about this study. In particular, it’s possible that those with chronic diseases don’t tend to drink coffee.
This study needs to be reviewed in the larger context of similar studies and consistency of results across studies, with the constant caution that this was not a randomized experiment. Whereas a statistical analysis can still “adjust” for other potential confounding variables, we are not yet convinced that researchers have identified them all or completely isolated why this decrease in death risk is evident. Researchers can now take the findings of this study and develop more focused studies that address new questions.
Outside Resources
- Website: Society for Ambulatory Assessment
- http://www.ambulatory-assessment.org
- Apps: Interactive web applets for teaching and learning statistics include the collection at
- http://www.rossmanchance.com/applets/
- Web: Inter-university Consortium for Political and Social Research
- http://www.icpsr.umich.edu/index.html
- Web: The Consortium for the Advancement of Undergraduate Statistics
- https://www.causeweb.org/
Vocabulary
- Ambulatory assessment
- An overarching term to describe methodologies that assess the behavior, physiology, experience, and environments of humans in naturalistic settings.
- Daily Diary method
- A methodology where participants complete a questionnaire about their thoughts, feelings, and behavior of the day at the end of the day.
- Day reconstruction method (DRM)
- A methodology where participants describe their experiences and behavior of a given day retrospectively upon a systematic reconstruction on the following day.
- Ecological momentary assessment
- An overarching term to describe methodologies that repeatedly sample participants’ real-world experiences, behavior, and physiology in real time.
- Ecological validity
- The degree to which a study finding has been obtained under conditions that are typical for what happens in everyday life.
- Electronically activated recorder, or EAR
- A methodology where participants wear a small, portable audio recorder that intermittently records snippets of ambient sounds around them.
- Experience-sampling method
- A methodology where participants report on their momentary thoughts, feelings, and behaviors at different points in time over the course of a day.
- External validity
- The degree to which a finding generalizes from the specific sample and context of a study to some larger population and broader settings.
- Full-cycle psychology
- A scientific approach whereby researchers start with an observational field study to identify an effect in the real world, follow up with laboratory experimentation to verify the effect and isolate the causal mechanisms, and return to field research to corroborate their experimental findings.
- Generalize
- Generalizing, in science, refers to the ability to arrive at broad conclusions based on a smaller sample of observations. For these conclusions to be true the sample should accurately represent the larger population from which it is drawn.
- Internal validity
- The degree to which a cause-effect relationship between two variables has been unambiguously established.
- Linguistic inquiry and word count
- A quantitative text analysis methodology that automatically extracts grammatical and psychological information from a text by counting word frequencies.
- Lived day analysis
- A methodology where a research team follows an individual around with a video camera to objectively document a person’s daily life as it is lived.
- White coat hypertension
- A phenomenon in which patients exhibit elevated blood pressure in the hospital or doctor’s office but not in their everyday lives.
- Cause-and-effect
- Related to whether we say one variable is causing changes in the other variable, versus other variables that may be related to these two variables.
- Confidence interval
- An interval of plausible values for a population parameter; the interval of values within the margin of error of a statistic.
- Distribution
- The pattern of variation in data.
- Generalizability
- Related to whether the results from the sample can be generalized to a larger population.
- Margin of error
- The expected amount of random variation in a statistic; often defined for 95% confidence level.
- Parameter
- A numerical result summarizing a population (e.g., mean, proportion).
- Population
- A larger collection of individuals that we would like to generalize our results to.
- P-value
- The probability of observing a particular outcome in a sample, or more extreme, under a conjecture about the larger population or process.
- Random assignment
- Using a probability-based method to divide a sample into treatment groups.
- Random sampling
- Using a probability-based method to select a subset of individuals for the sample from the population.
- Sample
- The collection of individuals on which we collect data.
- Statistic
- A numerical result computed from a sample (e.g., mean, proportion).
- Statistical significance
- A result is statistically significant if it is unlikely to arise by chance alone.
References
- Baumeister, R. F., Vohs, K. D., & Funder, D. C. (2007). Psychology as the science of self-reports and finger movements: Whatever happened to actual behavior? Perspectives on Psychological Science, 2, 396–403.
- Bolger, N., & Laurenceau, J-P. (2013). Intensive longitudinal methods: An introduction to diary and experience sampling research. New York, NY: Guilford Press.
- Bolger, N., Davis, A., & Rafaeli, E. (2003). Diary methods: Capturing life as it is lived. Annual Review of Psychology, 54, 579–616.
- Bond, R. M., Jones, J. J., Kramer, A. D., Marlow, C., Settle, J. E., & Fowler, J. H. (2012). A 61 million-person experiment in social influence and political mobilization. Nature, 489, 295–298.
- Brewer, M. B. (2000). Research design and issues of validity. In H. T. Reis & C. M. Judd (Eds.), Handbook of research methods in social psychology (pp. 3–16). New York, NY: Cambridge University Press.
- Cohn, M. A., Mehl, M. R., & Pennebaker, J. W. (2004). Linguistic indicators of psychological change after September 11, 2001. Psychological Science, 15, 687–693.
- Conner, T. S., Tennen, H., Fleeson, W., & Barrett, L. F. (2009). Experience sampling methods: A modern idiographic approach to personality research. Social and Personality Psychology Compass, 3, 292–313.
- Craik, K. H. (2000). The lived day of an individual: A person-environment perspective. In W. B. Walsh, K. H. Craik, & R. H. Price (Eds.), Person-environment psychology: New directions and perspectives (pp. 233–266). Mahwah, NJ: Lawrence Erlbaum Associates.
- Fahrenberg, J., &. Myrtek, M. (Eds.) (1996). Ambulatory assessment: Computer-assisted psychological and psychophysiological methods in monitoring and field studies. Seattle, WA: Hogrefe & Huber.
- Funder, D. C. (2007). The personality puzzle. New York, NY: W. W. Norton & Co.
- Funder, D. C. (2001). Personality. Review of Psychology, 52, 197–221.
- Gosling, S. D., & Johnson, J. A. (2010). Advanced methods for conducting online behavioral research. Washington, DC: American Psychological Association.
- Gosling, S. D., Ko, S. J., Mannarelli, T., & Morris, M. E. (2002). A room with a cue: Personality judgments based on offices and bedrooms. Journal of Personality and Social Psychology, 82, 379–398.
- Hektner, J. M., Schmidt, J. A., & Csikszentmihalyi, M. (2007). Experience sampling method: Measuring the quality of everyday life. Thousand Oaks, CA: Sage.
- Kahneman, D., Krueger, A., Schkade, D., Schwarz, N., and Stone, A. (2004). A survey method for characterizing daily life experience: The Day Reconstruction Method. Science, 306, 1776–780.
- Kaplan, R. M., & Stone A. A. (2013). Bringing the laboratory and clinic to the community: Mobile technologies for health promotion and disease prevention. Annual Review of Psychology, 64, 471-498.
- Killingsworth, M. A., & Gilbert, D. T. (2010). A wandering mind is an unhappy mind. Science, 330, 932.
- Lane, R. D., Zareba, W., Reis, H., Peterson, D., &, Moss, A. (2011). Changes in ventricular repolarization duration during typical daily emotion in patients with Long QT Syndrome. Psychosomatic Medicine, 73, 98–105.
- Lewin, K. (1944) Constructs in psychology and psychological ecology. University of Iowa Studies in Child Welfare, 20, 23–27.
- Mehl, M. R., & Conner, T. S. (Eds.) (2012). Handbook of research methods for studying daily life. New York, NY: Guilford Press.
- Mehl, M. R., Pennebaker, J. W., Crow, M., Dabbs, J., & Price, J. (2001). The electronically activated recorder (EAR): A device for sampling naturalistic daily activities and conversations. Behavior Research Methods, Instruments, and Computers, 33, 517–523.
- Mehl, M. R., Robbins, M. L., & Deters, G. F. (2012). Naturalistic observation of health-relevant social processes: The electronically activated recorder (EAR) methodology in psychosomatics. Psychosomatic Medicine, 74, 410–417.
- Mehl, M. R., Vazire, S., Ramírez-Esparza, N., Slatcher, R. B., & Pennebaker, J. W. (2007). Are women really more talkative than men? Science, 317, 82.
- Miller, G. (2012). The smartphone psychology manifesto. Perspectives in Psychological Science, 7, 221–237.
- Mortenson, C. R., & Cialdini, R. B. (2010). Full-cycle social psychology for theory and application. Social and Personality Psychology Compass, 4, 53–63.
- Pennebaker, J. W., Mehl, M. R., Niederhoffer, K. (2003). Psychological aspects of natural language use: Our words, our selves. Annual Review of Psychology, 54, 547–577.
- Ramírez-Esparza, N., Mehl, M. R., Álvarez Bermúdez, J., & Pennebaker, J. W. (2009). Are Mexicans more or less sociable than Americans? Insights from a naturalistic observation study. Journal of Research in Personality, 43, 1–7.
- Rathje, W., & Murphy, C. (2001). Rubbish! The archaeology of garbage. New York, NY: Harper Collins.
- Reis, H. T., & Gosling, S. D. (2010). Social psychological methods outside the laboratory. In S. T. Fiske, D. T. Gilbert, & G. Lindzey, (Eds.), Handbook of social psychology (5th ed., Vol. 1, pp. 82–114). New York, NY: Wiley.
- Sapolsky, R. (2004). Why zebras don’t get ulcers: A guide to stress, stress-related diseases and coping. New York, NY: Henry Holt and Co.
- Schlotz, W. (2012). Ambulatory psychoneuroendocrinology: Assessing salivary cortisol and other hormones in daily life. In M.R. Mehl & T.S. Conner (Eds.), Handbook of research methods for studying daily life (pp. 193–209). New York, NY: Guilford Press.
- Smyth, J., Ockenfels, M. C., Porter, L., Kirschbaum, C., Hellhammer, D. H., & Stone, A. A. (1998). Stressors and mood measured on a momentary basis are associated with salivary cortisol secretion. Psychoneuroendocrinology, 23, 353–370.
- Stone, A. A., & Shiffman, S. (1994). Ecological momentary assessment (EMA) in behavioral medicine. Annals of Behavioral Medicine, 16, 199–202.
- Stone, A. A., Reed, B. R., Neale, J. M. (1987). Changes in daily event frequency precede episodes of physical symptoms. Journal of Human Stress, 13, 70–74.
- Webb, E. J., Campbell, D. T., Schwartz, R. D., Sechrest, L., & Grove, J. B. (1981). Nonreactive measures in the social sciences. Boston, MA: Houghton Mifflin Co.
- White, W. B., Schulman, P., McCabe, E. J., & Dey, H. M. (1989). Average daily blood pressure, not office blood pressure, determines cardiac function in patients with hypertension. Journal of the American Medical Association, 261, 873–877.
- Whyte, W. H. (1980). The social life of small urban spaces. Washington, DC: The Conservation Foundation.
- Wilhelm, F.H., & Grossman, P. (2010). Emotions beyond the laboratory: Theoretical fundaments, study design, and analytic strategies for advanced ambulatory assessment. Biological Psychology, 84, 552–569.
- Wilhelm, P., Perrez, M., & Pawlik, K. (2012). Conducting research in daily life: A historical review. In M. R. Mehl & T. S. Conner (Eds.), Handbook of research methods for studying daily life. New York, NY: Guilford Press.
- Wilson, R., & Gosling, S. D., & Graham, L. (2012). A review of Facebook research in the social sciences. Perspectives on Psychological Science, 7, 203–220.
- Yarkoni, T. (2012). Psychoinformatics: New horizons at the interface of the psychological and computing sciences. Current Directions in Psychological Science, 21, 391–397.
- Amabile, T. (1985). Motivation and creativity: Effects of motivational orientation on creative writers. Journal of Personality and Social Psychology, 48(2), 393–399.
- Freedman, N. D., Park, Y., Abnet, C. C., Hollenbeck, A. R., & Sinha, R. (2012). Association of coffee drinking with total and cause-specific mortality. New England Journal of Medicine, 366, 1891–1904.
- Hamlin, J. K., Wynn, K., & Bloom, P. (2007). Social evaluation by preverbal infants. Nature, 452(22), 557–560.
- Ramsey, F., & Schafer, D. (2002). The statistical sleuth: A course in methods of data analysis. Belmont, CA: Duxbury.
- Short, T., Moriarty, H., & Cooley, M. E. (1995). Readability of educational materials for patients with cancer. Journal of Statistics Education, 3(2).
- Stanovich, K. (2013). How to think straight about psychology (10th ed.). Upper Saddle River, NJ: Pearson.
Authors

Matthias Mehl is an Associate Professor of Psychology at the University of Arizona where he also holds adjunct appointments in the Department of Communication, the Arizona Cancer Center, and the Evelyn F. McKnight Brain Institute. He currently serves as Vice President of the Society for Ambulatory Assessment.

Beth Chance is Professor of Statistics at Cal Poly – San Luis Obispo. She is a Fellow of the American Statistical Association, the inaugural winner of the Waller Education Award for excellence and innovation in teaching undergraduate statistics, and a 2011 MERLOT Classics Award for technology tools development.

Allan Rossman, Professor of Statistics at Cal Poly – San Luis Obispo, has written curricular materials and conducted many faculty development workshops related to undergraduate statistics education. He is a Fellow of the American Statistical Association and a recipient of the Mathematical Association of America’s Haimo Award for Distinguished Teaching.


 Statistical Thinking by Beth Chance and Allan Rossman is licensed under a Creative Commons Attribution-NonCommercial-ShareAlike 4.0 International License. Permissions beyond the scope of this license may be available in our Licensing Agreement.
Creative Commons License
Conducting Psychology Research in the Real World by Matthias R. Mehl is licensed under a Creative Commons Attribution-NonCommercial-ShareAlike 4.0 International License. Permissions beyond the scope of this license may be available in our Licensing Agreement.

