
Midterm Project Amy Gong
USA
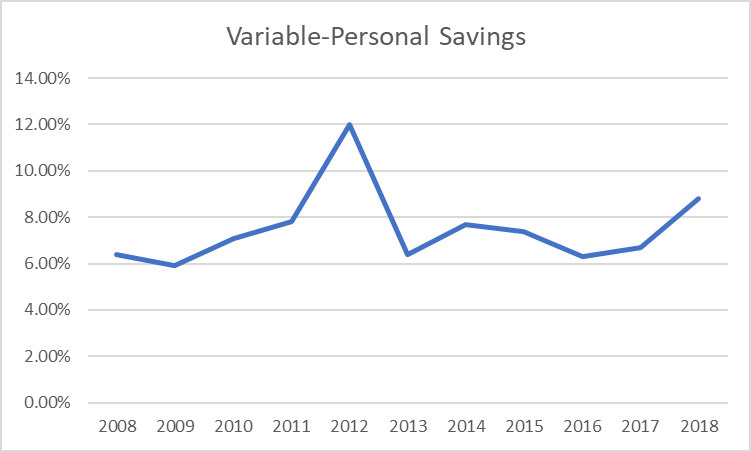
Personal Savings is the percentage of how much people save from the total income they get. It starts at around 6% in 2008. It will eventually rise to the highest of 12% before going back to around 6% then rising a little to around 8%. It then goes back to 6 before at the end of the graph, at 2018, rising to 9%. It increased then decreased then increased a little before decreasing again and finally increasing at the end.
I think people saved the way they did because of the Great Recession. At the beginning people couldn’t save more because the Great Recession happened and they needed to spend money on necessities. May people lost their jobs during the Great Recession. Because of that, they had problems with saving money. Whatever they made, went towards paying bills instead of savings. As a result, the amunt of savings fell during this period.
In 2011 to 2013, I think that since the Great Recession ended, people saved more just in case they would need it. A notable recession had recently happened. From 2014 to 2015 I think as the economy recovered, people just wanted to save up a little more. Maybe they just felt like it. For 2018, there were more savings and I think that maybe that happened because people became unsure when the next bubble will pop. People got more optimistic and spendthrift.
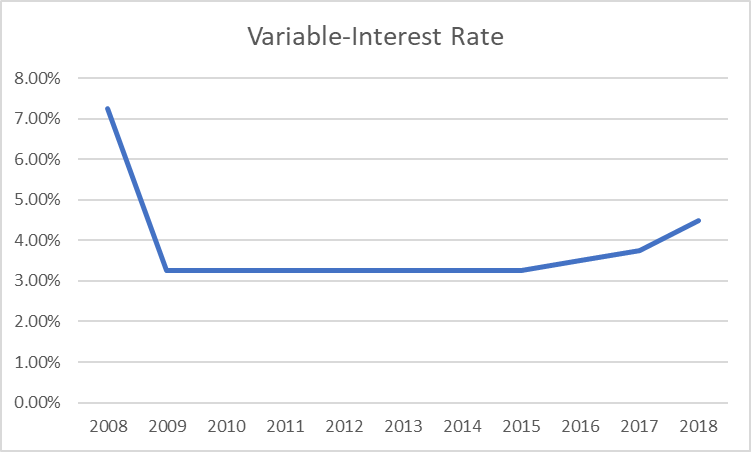
Interest Rate is the percentage increase you pay back with your loan. It starts high before the next year decreasing. It stays the same after that until the end. At 2017, it increases. In 2018, it also decreases. So at the end, it increases aka 2017 and 2018 both have increases.
I think the interest rate was lowered so people would take more loans out. The interest rate started at around 7%. I think it was lowered because of the Great Recession. If people look out more loans and started their business the economy would be in better shape. The goal was by lowering the interest rate, people would be spending more money and borrowing more. As a result, it would lead to an increase in the money flow to help the economy.
It stayed nearly the same because that is when the Great Recession is happening and there was economic turmoil. People’s futures were not clear and they didn’t have that much confidence in the economy. The economy recovered and confidence was back in 2017. It makes sense for a rise in the interest rate in 2017 and 2018. The economy had somewhat recovered. The target was that by increasing the interest rate, people would borrow less and save more.
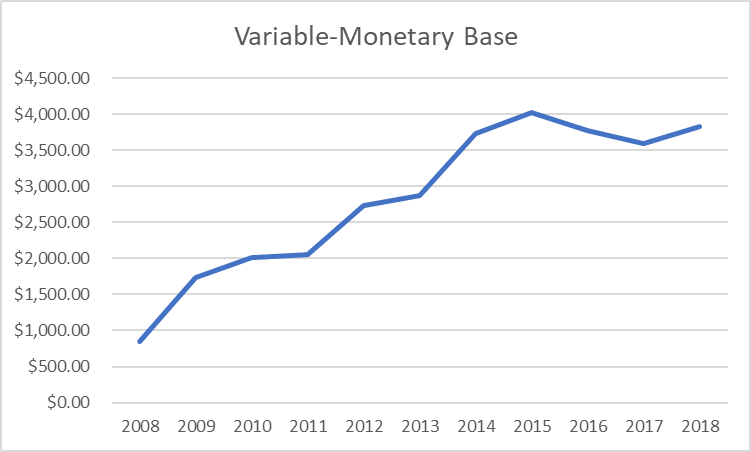
Monetary Base is how much money people or the public have plus their bank’s accounts. It is also known as Money Base. The monetary base for the most part increases in the graph. It starts around $1,000 Billion. It then keeps increases until the highest part which is $4,000 Billion in 2015. It then decreases until 2017. 2017 is $around $3,500 Billion. In 2018, it raises to around but less than $4,000 Billion. This graph is basically just increasing.
I think the monetary base increased because more money was put in circulation. I think it increased so the economy could recover from the Great Recession. Banks increased the cash people had access to. The goal was, after people had more cash, they would spend more money in the economy. If they spent more money, it would increase consumption and give a boost to the economy. This policy continued for a while, until 2015.
As the economy recovered, the increased monetary base lowered because the higher monetary base was probably causing inflation. The monetary base was not lowered much because if the monetary base was lowered too quickly, there would be problems like more unemployment. The economy was better but still weak. After 2017, the money supply went up again. It was most likely due to the improving economy.
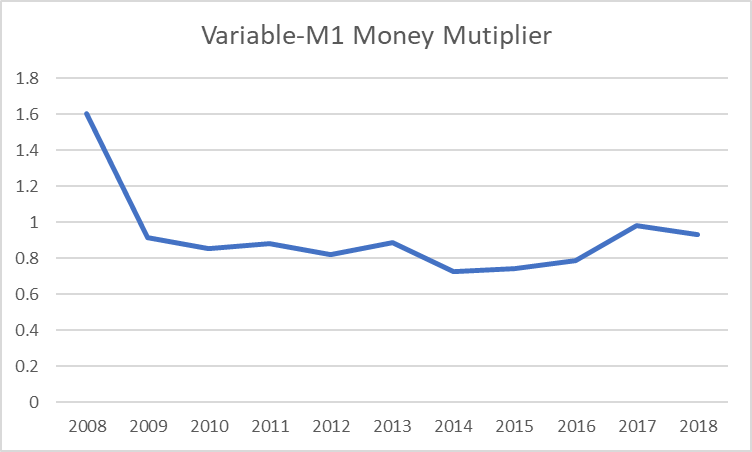
M1 Money Multiplier is how much money banks earn with every dollar in its reserves. The graph decreases during the 10-year period. It most decreases. It is a downward slope. It goes down until 2012-2013. Then it raises a tiny amount. It then goes down to the lowest point in 2014 until raising a little until 2017. The final year it decreases again. The rate is nowhere near when it first started. It started at 1.6 and the rest is all around 0.9.
I think the money multiplier decreased because more money needed to be put out in the economy. The U.S. was dealing with the Great Recession. President Obama resolved the economy with his actions. Banks had less money in reserves because money was needed outside their reserves. They had to spend money.
Another reason the money multiplier went done is the low interest rates. Recession caused the government to lower interest rates quickly and by large margin. As a result, when people borrowed from the bank, the bank did not make as much profit from the loan as they would have made. Because of that, over time, the money multiplier went down.
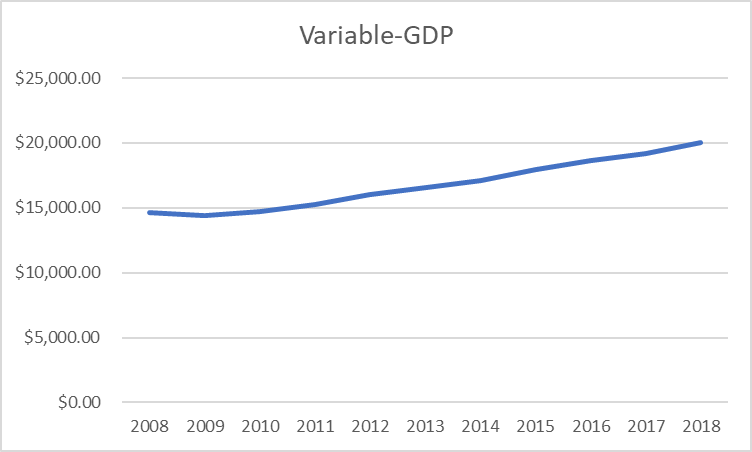
GDP is the total money value of all goods and services sold in a country during a period of time usually 1 year. The line in this graph goes up. In the beginning it stays the same. The line is straight. Nearing the middle the line increases. It continues to increase until the end.
I think GDP stayed the same in the beginning years of the graph because of the Great Recession. People spent the same as they used to before trouble came in. Once trouble came in, people’s spending changed. In the beginning years, how much people spent stayed the same because there wasn’t much confidence in the market. They worried and spent less.
When the recession was over, it is likely people spent more because they had less to worry about. The economy gets better year after year after the Great Recession. People became more confident in the economy. More people had jobs and people spent more money. As a result, the GDP of America increased.
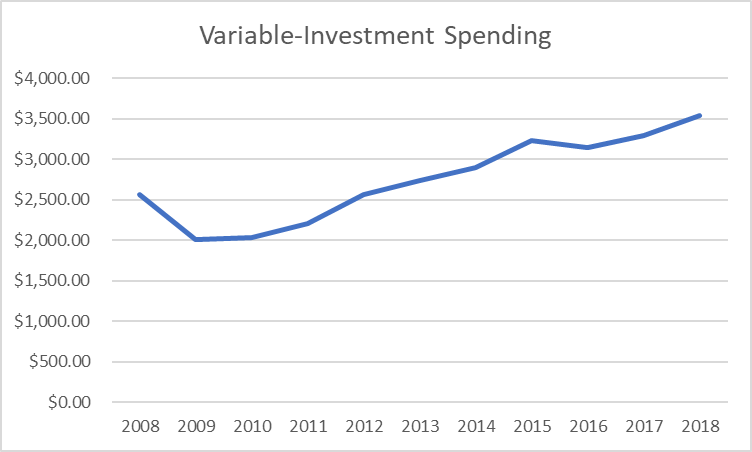
Investment Spending is money spent to increase the goods someone is producing. Buying new machinery to be able to produce a certain good is an example of investment spending. For the most part, investment spending decreases. The graph starts with a decrease but then everything after that until 2015-2016 is an increase. In between 2015 and 2016, there is a slight decrease. After that it is only increases.
I think investment spending fell from 2008 and 2009 because of the Great Recession. Things done to end the Great Recession caused more investment spending. During the recession, at least in the earlier days, people would rather hold on to their money than invest it in a volatile market. However, with the falling interest rate, the situation changed slowly. In 2009, the investment spending went down before investment spending went up.
After the low in 2009, there was basically more investment spending. It should be caused by increased confidence and the lowered interest rate. Investment spending creates more goods and services which leads to more jobs which is the cause of the end of the Great Recession. People spend more to improve their standard of living or lives. The increased interest rate probably also contributed to increased investment.
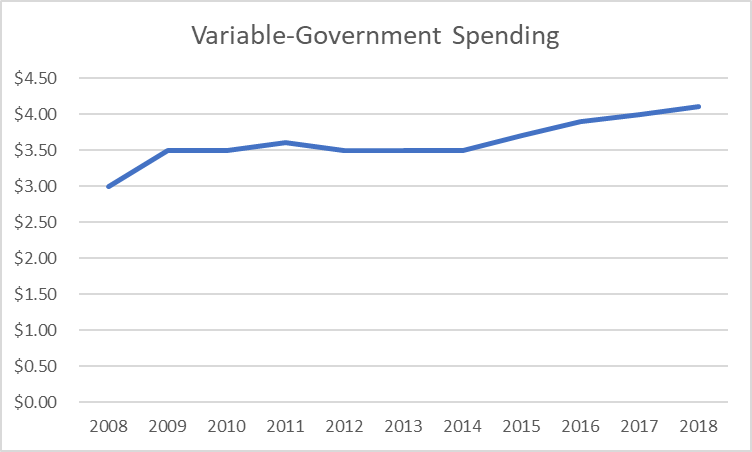
Government Spending is how much money the government spends per year. A There are no decreases in the graph. It starts with $3 trillion and ends with around $4 trillion. There is an increase from 2008 to 2009. After that, it is like a flat line until 2014 to 2015. From 2014 to 2018, the spending increases.
Government spending increased from 2008 to 2009 because of the efforts to improve the economy and fix the Great Recession. The goal was that by investing money, the economy would improve because it would drive more economic activities. This contributed heavily towards the recovery of the Great Recession. Without government spending, it would have been almost impossible for the Great recession to end.
The government spending has increased since then mostly because of expansion of mandatory spending. Programs like Medicaid, Medicare, and supplemental nutritional assistance program form the largest spending categories in the government budget. The programs keep getting bigger and bigger over time. This leads to increased government spending. The increased spending leads to a budget deficit.

