Category: Projects (Page 3 of 4)
I will use desmos to graph a quadratic function showing the points of intersection on the x-axis. Additionally, I will show how to get the roots of the equation manually using the quadratic formula.
Hello everybody, my presentation will be on solving inequalities. I will give a brief definition of inequality and some factors that can change direction of inequality. I will talk about the symbols, solve some exercises and show how it looks like in a graph.
In my presentation I will be reviewing the basic trig functions of sin cos and tangent. And will be showing how it was created using a diagram of a right triangle. I will give a problem to the class and show how a unit circle is helpful and that it is a great tool to understand sines and cosines in right triangles.
Here is my demos link: https://www.desmos.com/calculator/rkizfzqjon
I .Do Now: read the following problem. https://www.desmos.com/calculator/ecnyow98r1
Marry has decided to plants some flowers, so she can make packet money. She will spend up to $180 for the seeds. One rose seeds cast $15, one peony seeds cost $5. She has enough space for plant 16 flowers. She wants to plants at lest 3 peonies and at lest 8 roses. If peonies earn$40 for her and the roses earn $60. how many of each type should marry to plant to maximize the amount of packet money she can make?
1. From the problem, list all the constraints:
- She will only spend up to $180 for the seeds.
- she has space only for 16 flowers.
- she wants plant at lest 3 peonies and 8 roses
2. Find variables:
let x = # of roses and let y = # of peonies
II. Use Desmos to solve the problem by turning all the constraints into Inequalities.
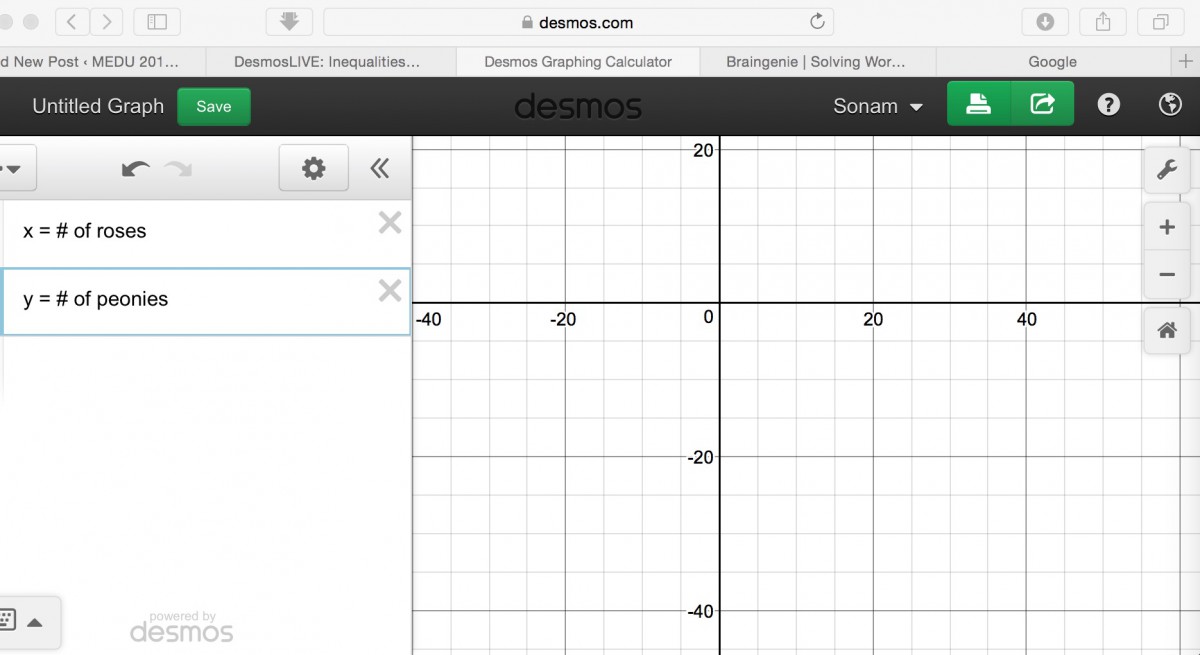
1. Turn the first two boxes of Desmos Graphing Calculator into a text boxes.
Type in our variables x = # of roses and let y = # of peonies
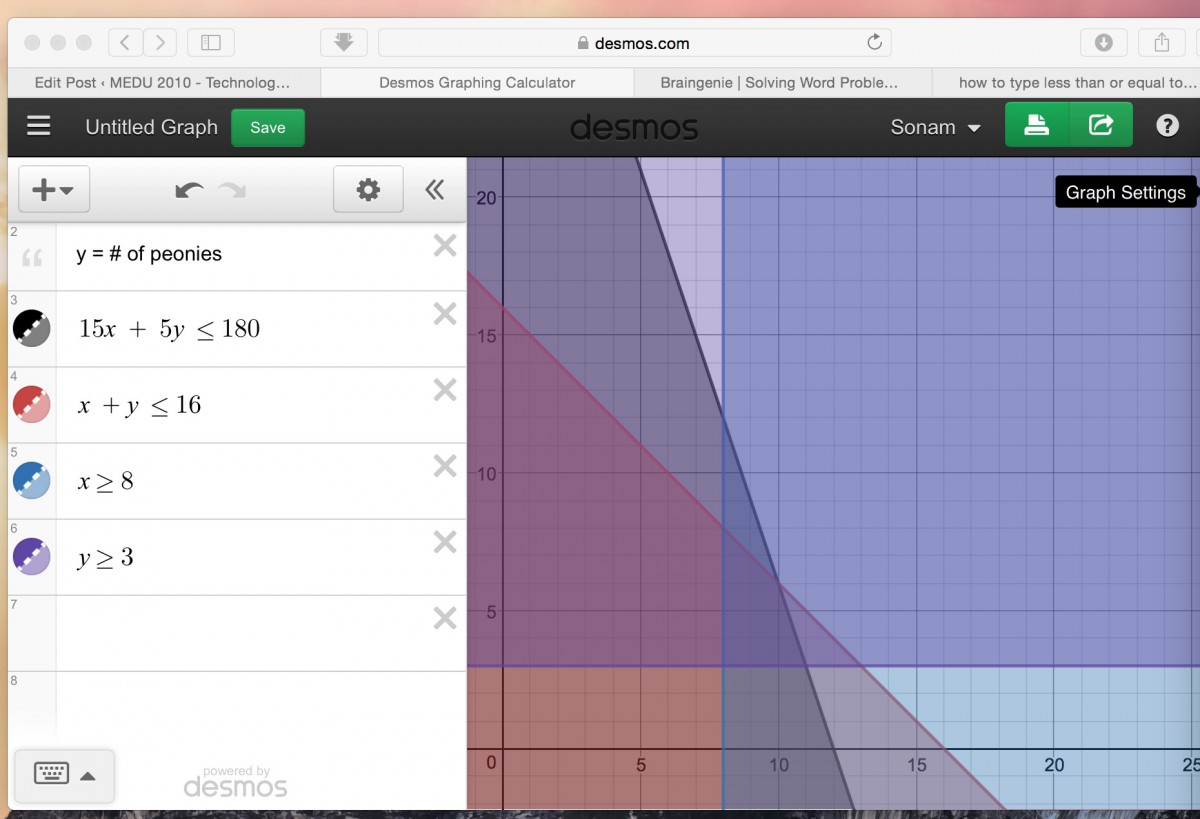
2. Turn the all constraints into inequalities and type then into the boxes of Desmos Graphing Calculator.
- 15x + 5y ≤ 180
- x + y ≤ 16
- y ≥ 3
- x ≥ 8
3. Turn everything into same color, that will make the region that we’re looking for a little bit more clear, because it just the darkest region.
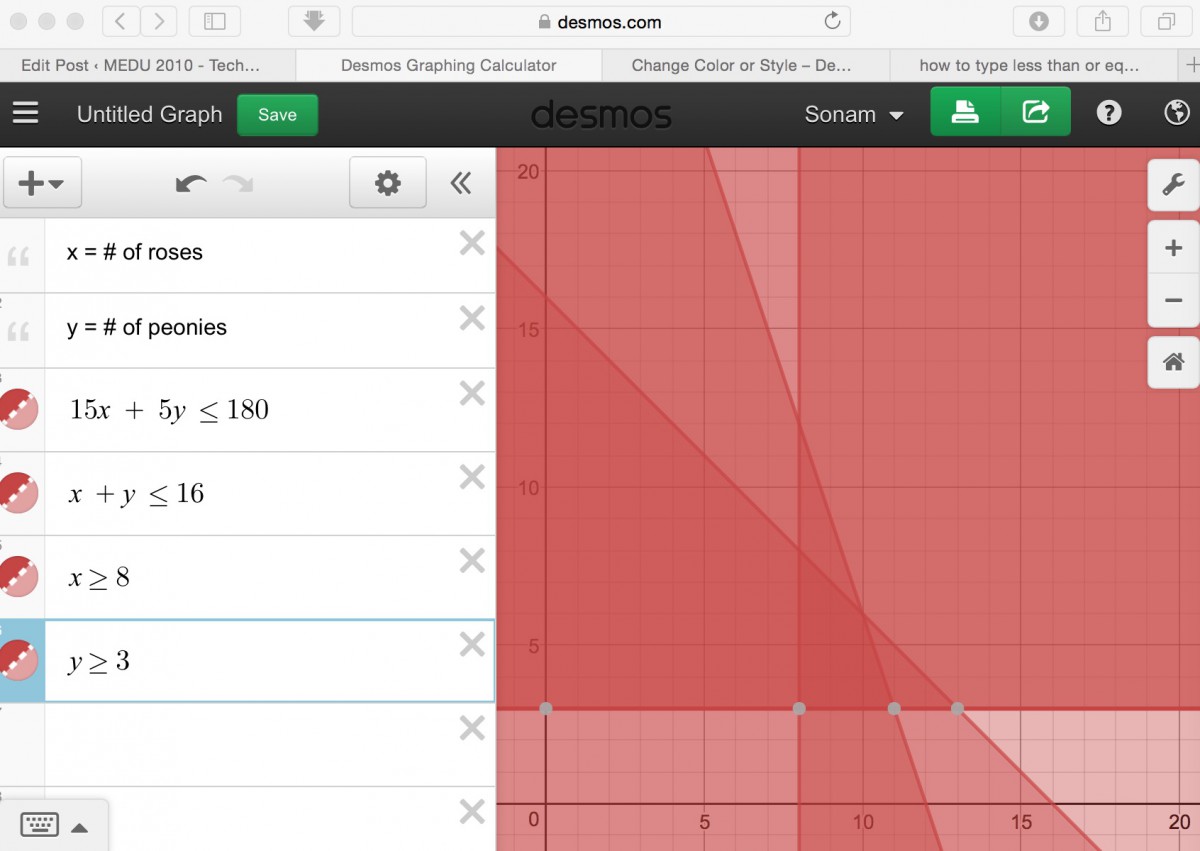
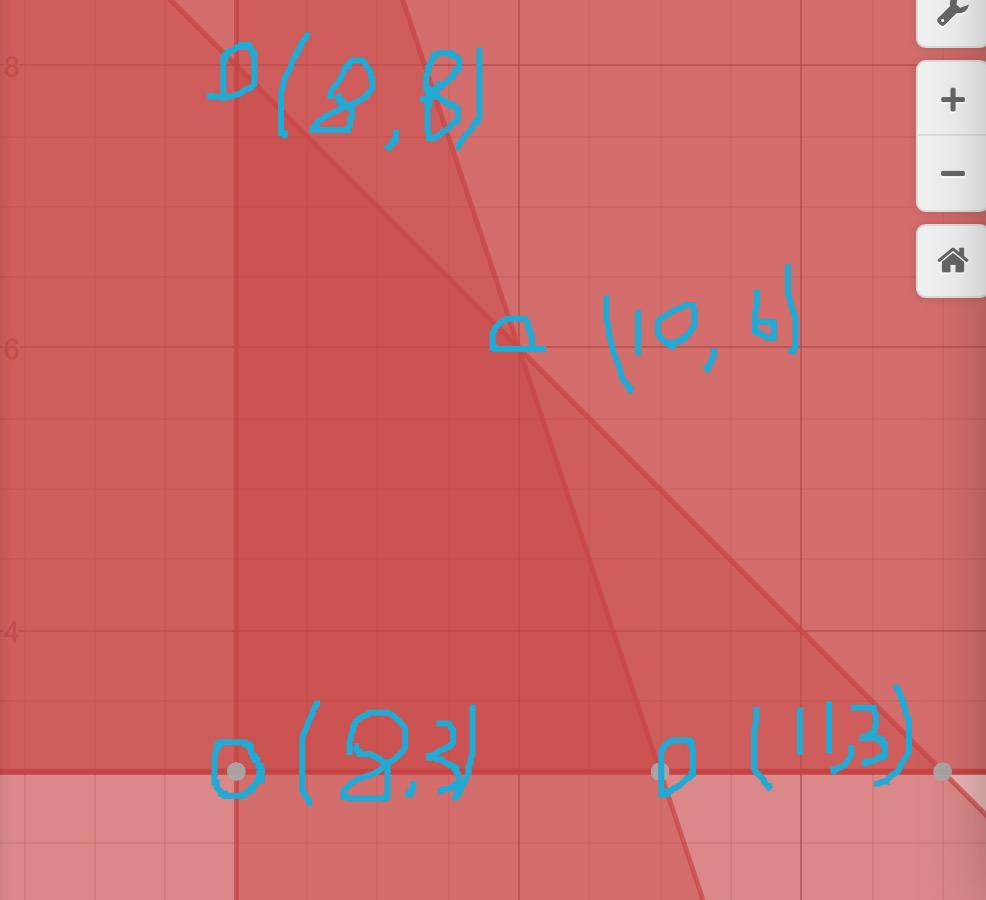
4. The four sets of intersection of the darkest region are the sets that satisfied of our constraints.
- (10,6)
- (11,3)
- (8,3)
- (8,8)
III. Solve the problem by set up a function with two variables x and y.
- f(x,y) = x(60) + y(40)
- Plug the four sets into the function.
- f(10,6) = 840
- f(11,3) = 780
- f(8,3) =600
- f(8,8) = 800
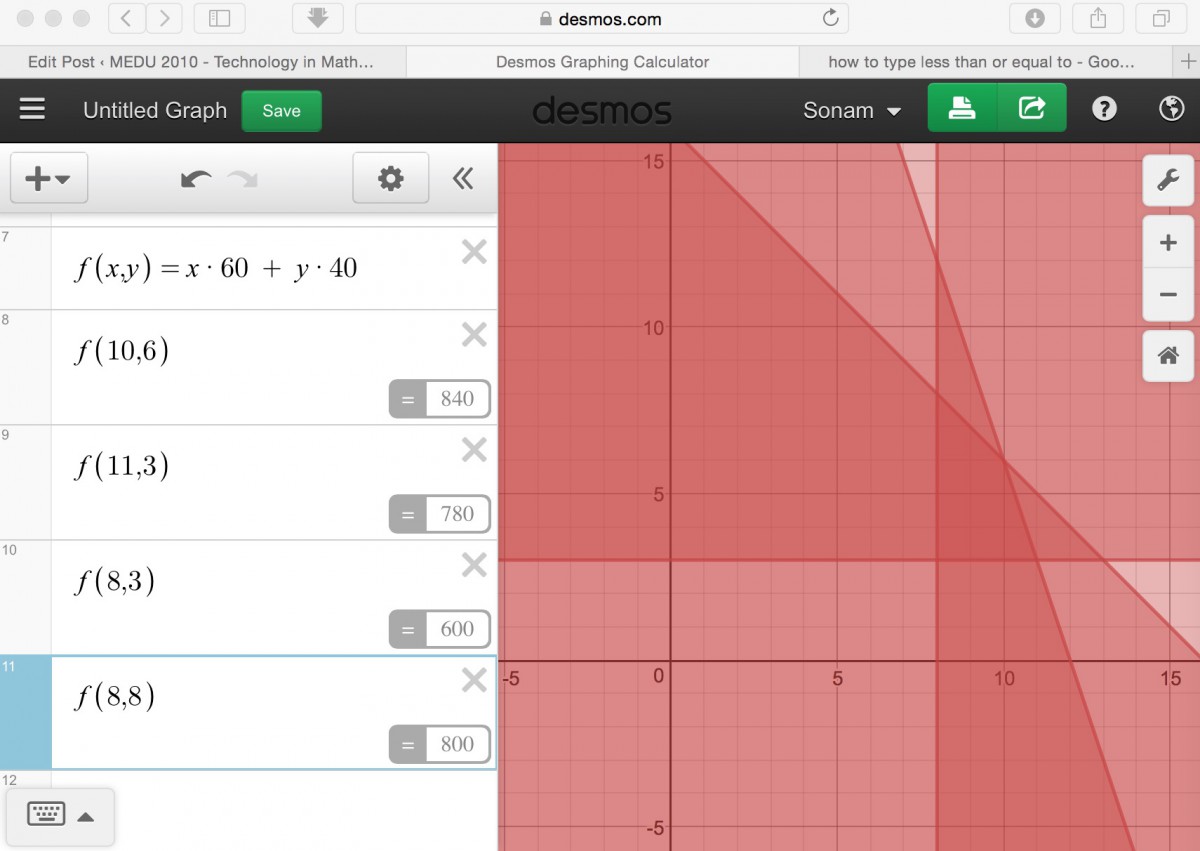
IV. Conclusion :
As you can see when x = 10 and y = 6, Marry can make the maximum of money $840. So she should plants 10 roses and 6 peonies.
In my project I would be defining what is a exponential function is and also asking a question that will help students understand what is an exponential function using a real life example. I would be using desmos to help me graph the function by showing the different points that the question ask them to find so that the class can see the graph better than trying to graph the function themselves.
Hi everyone, I’ve skimmed your project #1 posts and I’m really looking forward to your presentations this week!
To save time, I’ve already determined the order you’ll speak in using the Random Thing Picker:
- Majid
- Josiel
- Sonam
- Armando
- Mei
- Luis
- Gary
- Eve
- Josue
- Jodel
- Tyniqua
Recall that you’ll have 10 minutes to present. We’ll fit in as many presentations as we can today and finish them up on Thursday.
Recall also that you’ll be offering feedback for each other’s presentations using this form. Refer to this rubric to assign values for the different components of each presentation. Your submissions will be anonymous and will be shared with the presenters once all presentations are complete.
My project is on calculating the area between two curves on an interval, I will briefly explain how to calculate this by hand (and I will calculate the integral at the end) but since this is a bit of a time consuming process, I will mostly show how to solve the given problem using Desmos with a few helpful reminders.
My topic as you can see is solving a system of linear/quadratic equation. During this lesson I will demonstrate how much easier it is to use desmos when it comes to solving a system of equations. I will explain step by step how the system is to be solved algebraically and of course demonstrate the pros of using desmos when it comes to solving it graphically.
https://www.desmos.com/calculator/cnz0mup3n5


Recent Comments