Here are a few interesting charts generated from Calculus II scores.
The first is the grade distribution for test #1. There are two noticeable peaks; a number of students earned grades in the 30’s and a number of students earned grades in the 60’s/70’s.

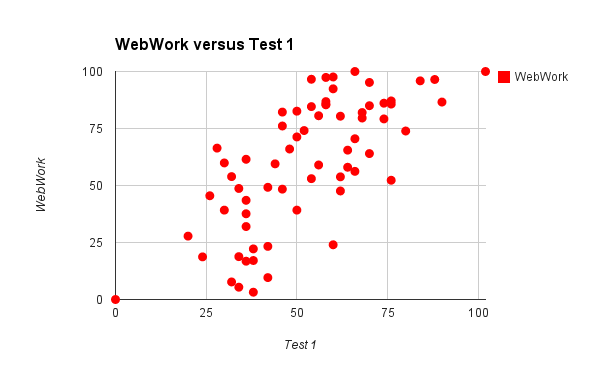
The second compares test #1 grades with WebWork grades. There seems to be a pretty obvious positive correlation between WebWork grades and test #1 grades, with WebWork grades as slightly higher than test #1 grades.
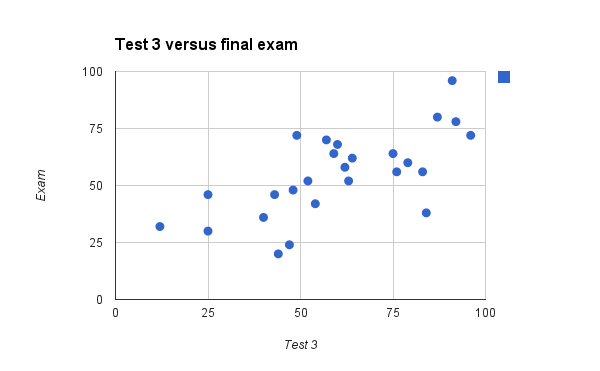
The third uses data from my MAT 1575 class from last semester. Last semester the test that covered sequences and series was test #3, toward the end of the semester. In particular, that test was taken only by students who remained enrolled in the class after the drop date. As you can see, there is a correlation between those students’ test #3 grades and their grades on the final exam. In particular, students’ test #3 grades were pretty good predictors of their final exam grades.