
Just FYI…
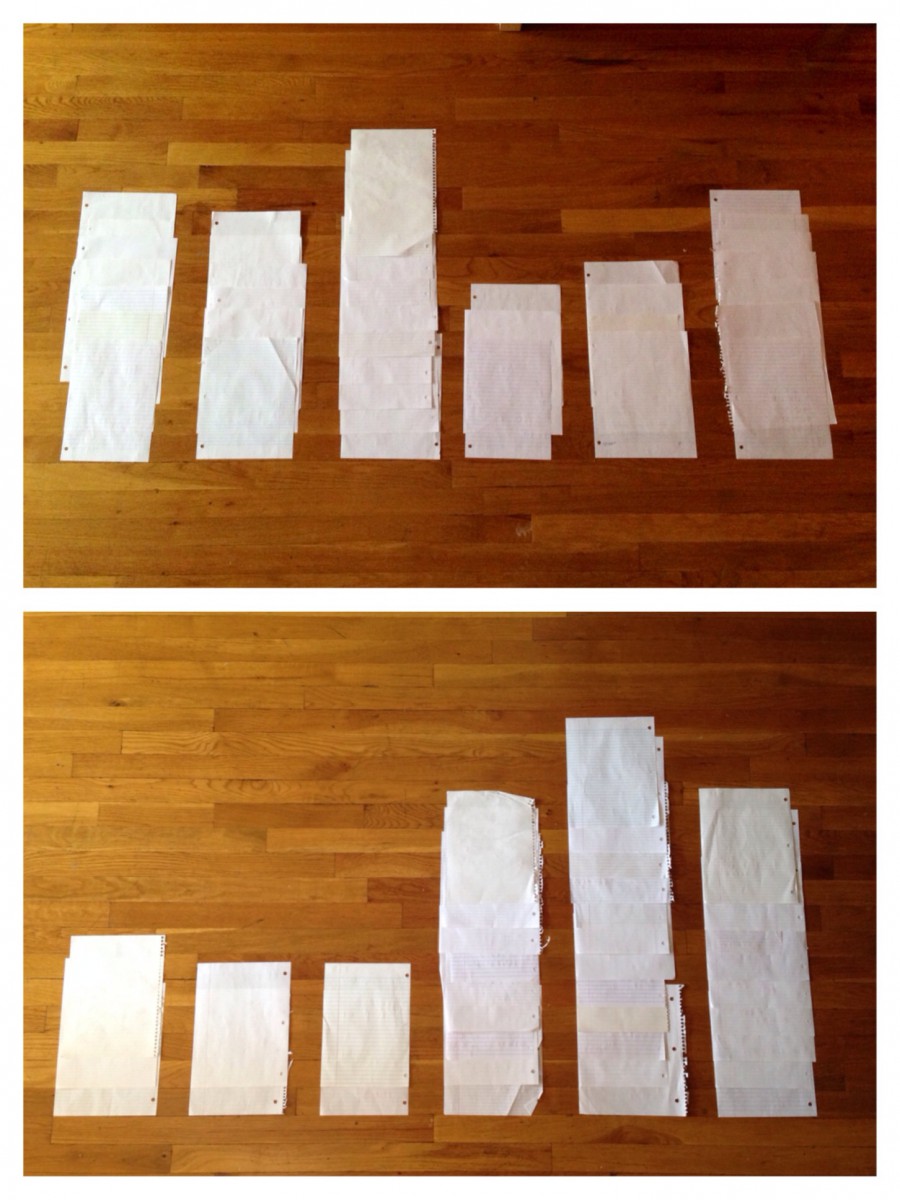
This image shows the class’s grade distribution for quiz #1 (top) and quiz #2 (bottom). It may not look very scientific, since I just laid the papers out on the floor instead of making a fancy bar graph, but I think it shows something interesting…

