Tag Archives: maps

BRIC

I really enjoyed our little trip lately. In the first place I was familiar with BRIC before, because they stay behind organization of free music events during summer in Prospect park . The art space by it self are cozy and nice, the idea of exhibition clear and understandable(which is extremely rare for contemporary art). Different authors present almost all types of information as maps, which on my opinion, return us back to the map concept by itself. Originally maps use to present personal information about author experience in order to make it usable for others, and that’s what all artists illustrate beautifully.

I personally find all works very interesting, no matter if they shows some political information about the US bombing, or social data about gentrification, demographic change of population, winning lottery statistic or just ‘drowning of imaginary places’ as Patricia Smith describe her paintings.
 

Mapping Brooklyn Exhibit

Most maps in “mapping Brooklyn exhibit” are expressive, and they spontaneously- draw one’s attention to things and ideas which have been seen normal and familiar at first glance!

“71 Square Miles map” was most interesting to me because the artist utilized a crazy idea rarely one could think of ; collected paper scraps lying in streets as waste; shaped,and converted them in a useful task or work.  Really, a such work has surprised me!

If you look closely at the map, you’ll find how every paper litter expresses and reflects a certain location at a certain street;  this is the creativity that always requires patience and long suffering not disparately available only in an artist.

Viewing this exhibit changed the way I perceived maps.  My Perception of maps was no more than the traditional rigid conception of the sites geographically, but now  I have realized the idea that maps have become an art forms to accommodate the requirements of daily life in convenient and easy way.

My  daily movements and the subsequent communication requires a plan or method of operation so as to memorize tasks, and prevent tasks from interfering with each other. Map ensures the implementation of these everyday tasks optimally.

BRIC in BK.

Many maps at BRIC stood out to me like the Foursquare log in/check in map but  the work that left an impression on me was the Joyce Kozloff piece called ‘Targets’.  It was this sphere like structure that you were able to enter and once inside you were able to see all of the countries that the U.S has bombed from 1945 to 2000. Another nice feature was the acoustics of the structure, because any time you said something it was echoed back at you.  I wouldn’t say this piece changed my perspective on maps but it did make me realize that almost all data can be put into map form, the data in ‘Targets’ just illustrated the fact that the U.S has an itchy trigger finger.  One data in my daily life that I would like to visualize on a map would be all of the places in NY that I have been to so far.

mapping brooklyn…

The map that was the most interesting to me was the 71 Square Miles. That was the map of Brooklyn covered in paper litter found on the individual streets. When I first looked at it, I didn’t think much of it. “Big deal, she stuck garbage on a map the shape of the borough.” However I read the description and then carefully examined it. I still cant believe the artist walked on every block of the borough and then placed the litter in the appropriate location on the map. Not only is that hard work, but a lot of patience is needed. Furthermore, I tried to make sense of the litter and it made perfect sense! Near Brighton, there was paper with Russian writing. Near Coney Island, there was a paper that said something about Hurricane Sandy.

I will admit, I thought I would be bored at this BRIC House. However, it turned out I enjoyed myself. These maps were definitely not what I thought it would be. In fact, they were much more descriptive, colorful and educational compared to the paper maps we see today, Does the Subway MTA map still exist? Of course it does, but everyone just uses their smartphones to make their way around. If I can choose something in my daily life that I could plot of a map, it would be a map of locations that I have communicated with, whether it’d be through text, email, facebook, instagram, etc.  My first choice would’ve been pictures, but I believe the newer iphones do have that capability!

Evaluating information, new due dates, and preparing for the off-campus activity Wednesday

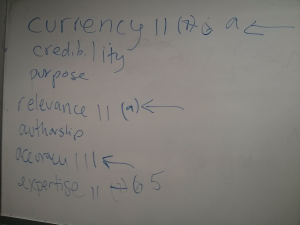
Today we crowdsourced evaluation criteria and came up with currency, relevance, and accuracy as 3 important criteria we’ll use in the evaluation activity in class on April 13. We also reviewed the annotaeval_criteria20150330ted bibliography assignment. Thanks to Steeve for showing us how the References feature in MS Word.

The blog post that would normally be due today (Monday, March 30) at 10 a.m. is due by Tuesday, March 31 at 10 a.m. Please write one research journal blog post in response to this prompt:

Do a search on your research topic in at least one internet search engine and one library database. What words or phrases did you use to search? What are the similarities and differences between the results of your two searches?

On Wednesday, we’ll visit the Mapping Brooklyn exhibition at BRIC at 647 Fulton Street, about a 10 minute walk from here. We will meet at 9:55 at the Jay Street entrance of the college and walk over together. Please let me know if you will be coming on your own so I know not to wait. We will finish by 11 a.m. so you’ll be on time for your 11:30 classes. I will distribute guidelines for the research paper outline and draft on Wednesday.

Tomorrow you’ll get an email from me with your midterm grade.

Please note there is a NEW DUE DATE for the annotated bibliography: you may hand it in as an email attachment to me by 5 p.m. on Thursday, April 2.

Questions about upcoming assigments, our schedule, or anything else? Please ask…

~Prof. Leonard