
On my second week at Statista, I was assigned to start designing an infographic for another team. I’m not allowed to reveal what it is, but admittedly it is a daunting task. I have done infographics in my Infographic Design class last semester, but I was nervous about this assignment because of the amount of content. Also, it as a bit difficult to convince the team director why her ideas she suggested where impractical for an infograph. That’s been the biggest challenge so far in this internship. I feel bad when I turn down ideas, but in the end I want to make sure it looks fantastic.
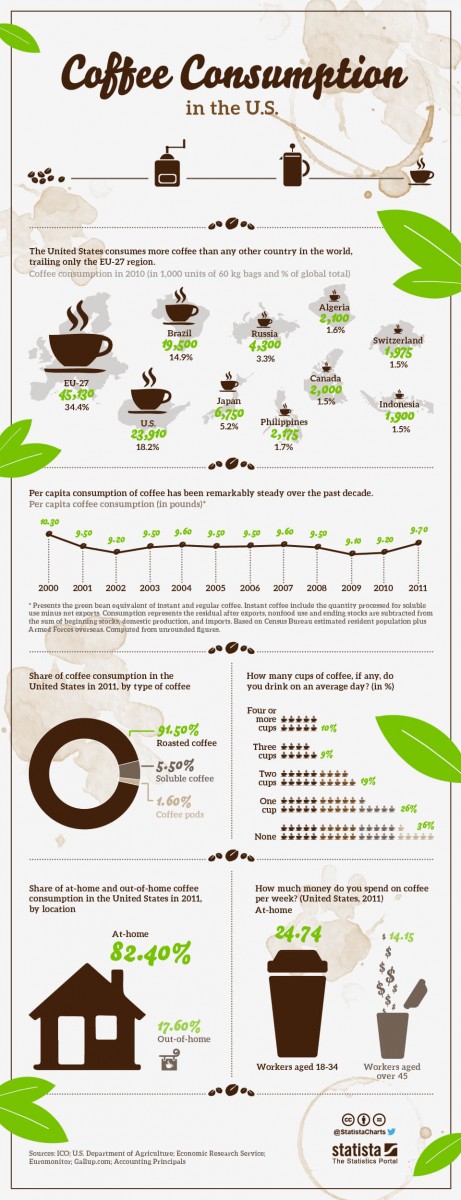
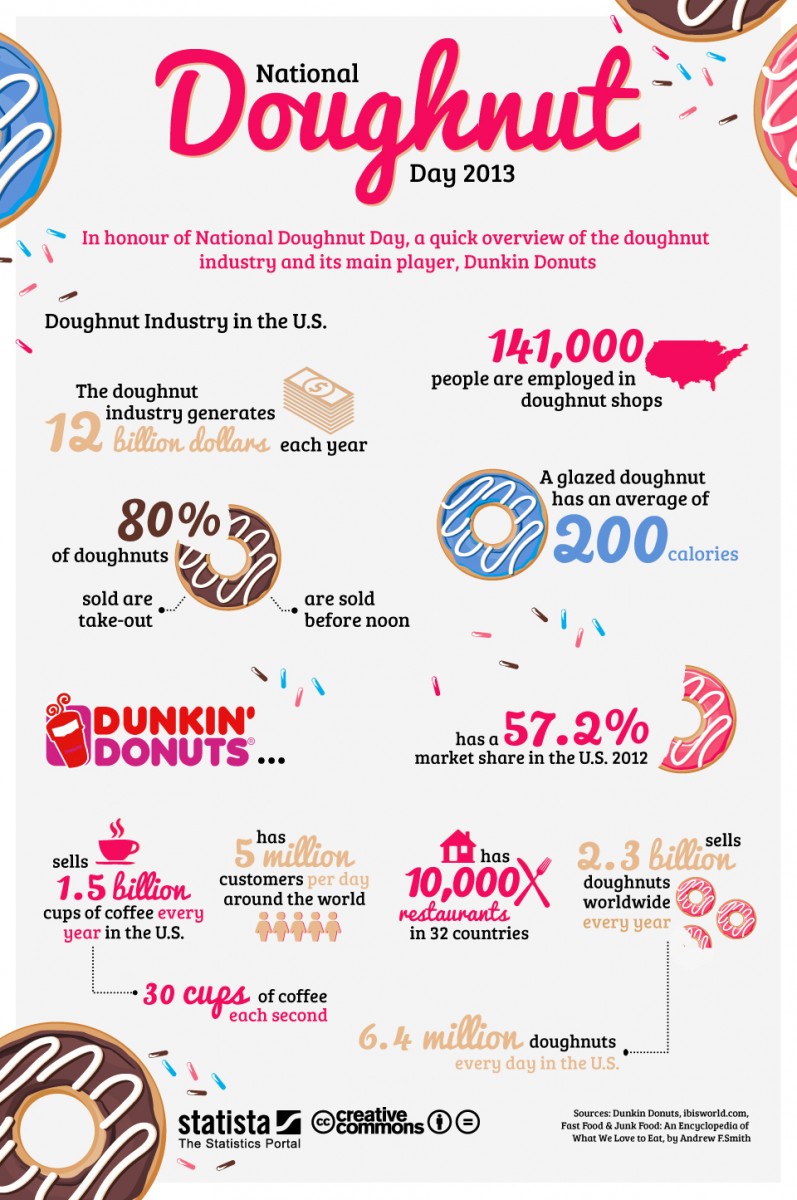
When I got the assignment, I started researching their infographic designs they have on their website. The two infographs shown below are a couple of infographs designed by a graphic design team in Germany. I used these two as reference to better understand how creative they want their infograph to be and brainstorming a concept.
Other than learning how to politely reject and explain why certain ideas would work to someone who is not a designer, I learned a couple of other things at this internship too.
I’ve learned how important it is to stay in contact with your team and communicating with the other staff members even if they are in a very different department. It helps boost morale and gives us the confidence we need to work on our projects. I think those are some of the lessons I find to be very useful when I take the Design Team course next semester and when I’m at a different workplace.
Source:
https://www.statista.com/chart/1165/national-doughnut-day-2013/
https://www.statista.com/chart/1667/coffee-consumption-in-the-us/

