This article is about Netflix growth. One of the things was it beat analysts’ predictions about its subscriber growth. Netflix last year gained 26 million new subscribers which were 50% more than the previous year’s growth. The surprising fact was Netflix growth accelerating in already developed markets of it’s like the U.S.
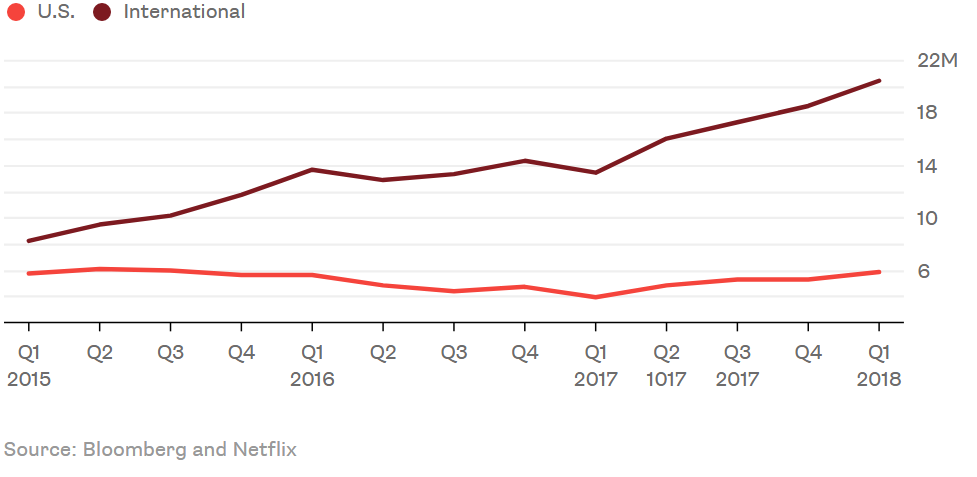
There was a line graph in the article showing the net new streaming customers for the past 12 months to show that the rate of new customer acquisition is increasing recently.
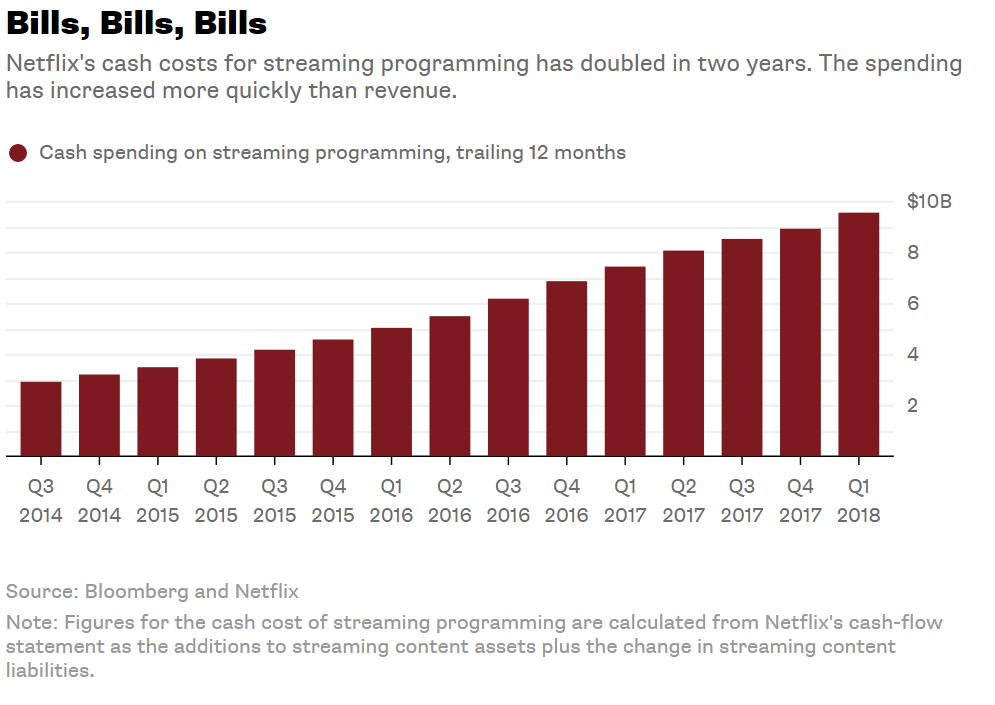
Then there was another graph which showed the costs Netflix must run its business. It was a histogram. It shows that Netflix’s cost is rising, so it needs to increase its customer growth accordingly.
Article Link : https://www.bloomberg.com/gadfly/articles/2018-04-16/netflix-earnings-don-t-worry-keep-spending


No one commented on it sadly even though I asked in class.
Way I’d improve this chart is by adding more labels on the y axis because right now it’s kinda unclear. The increments of 2 are kind of leaving things to be desired for the second chart for example. SImilarly for the first chart it’s kind of random as it goes from a 6 to a 10 so it can be improved in that aspect. The problem I’d like to make is what quarters did the growth rate for customers decrease from the previous quarter for international customers and then American customers. Then which one saw more decrease in growth rate quarters.
The answers are Q2 2016, Q1 2017
America saw growth rate decrease in all but Q1 2016, Q4 2016 and 2017- Q1 2018.
So growth rate for Netflix is decreasing in the Americas because it is a saturated market. Moreover only recently is the growth rate equal to what it was in the start of 2015.