The New York Times: “With 8 Years of Job Gains, Unemployment Is Lowest Since 1969”
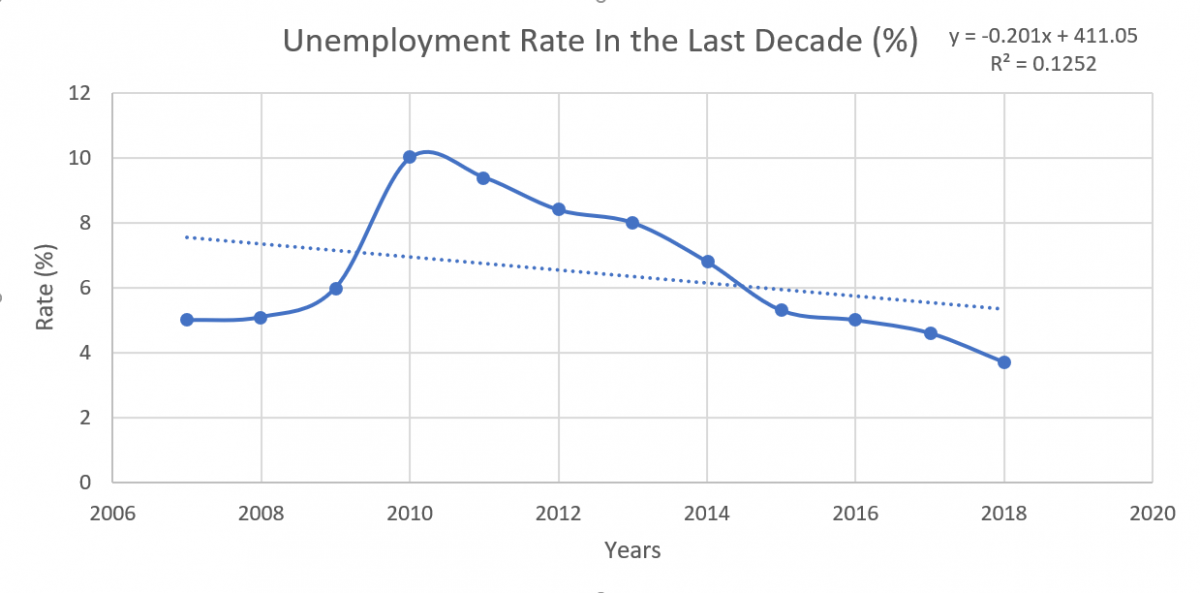
The article walks us through a series of historic events and factors which describes the following graph. Unemployment in the U.S has reached its lowest point since December of 1969 when hundreds of thousands of young Americans men were serving on Vietnam. In September of 2008 443,000 jobs were lost as the financial system was collapsing around it, millions of jobs were lost the months following. But after the hiring machine started, hundreds of thousands of jobs were created. 134,000 created on September alone makes it the 96th consecutive month growth. But as any other medium, this reflects into politics. The articles keep on presenting on how some economist don’t know how this milestone might not have any effects on voters on the polls as “surveys show that views of the economy are split along partisan lines, with Democrats and even many independents expressing less optimism than Republicans”.
This graph is a perfect representation on the events on the financial system in the last decade. On 2008 The financial crisis began with the lost of thousands of jobs. The years after did not show any signs of stopping as it reach its highest point on 2010. The years after are the results of carefully planning to fix the financial crisis which shows a slowly but surely slope going down as jobs are created throughout the years, landing at the lowest point at only 3.7% of unemployment.
Using the following approximation taken from the previous graph we can easily replicate and determine some interesting information:
| Years | 2007 | 2008 | 2009 | 2010 | 2011 | 2012 | 2013 | 2014 | 2015 | 2016 | 2017 | 2018 |
| Unemployment Rate (%) | 5 | 5.1 | 6 | 10 | 9.4 | 8.4 | 8 | 6.8 | 5.3 | 5 | 4.6 | 3.7 |
********************************************************************************
Response to :
Suggestions:
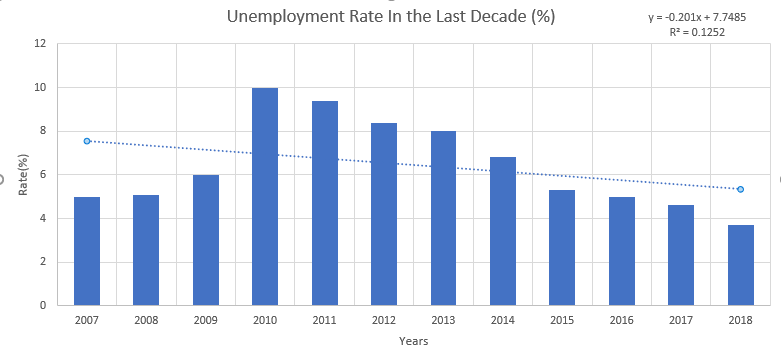
I believe that you made an even more detailed version of the original graph you selected, however I think that you could’ve further improved the graph by making a different version of it so it could truly be a reproduction of the original graph rather than a replica. Perhaps you could’ve done a bar graph rather than another line graph.
Word Problem:
In 2010 the unemployment rate was at an all time high being at up to 10% of Americans. By 2018 the unemployment rate gradually lowered down to less than 4%, how much was the unemployment rate lowered from 2010 to 2018?
Between the years 2010-2018 the difference between the employment rate is only 6.3%, where at 2010 it was at 10% and 2018 at 3.7%. This is a an astonishing decrease as it meant 1/10 of the working force or working capable people were unemployed, however, this trend started to disappear as the years progressed.
On the new bar graph we can even more clearly see what the tremendous change this country went through with the economic crisis at 2008 to the hardwork of many to bring the country back to stability.
********************************************************************************


