MAT1372 Statistics with Probability, FA2018
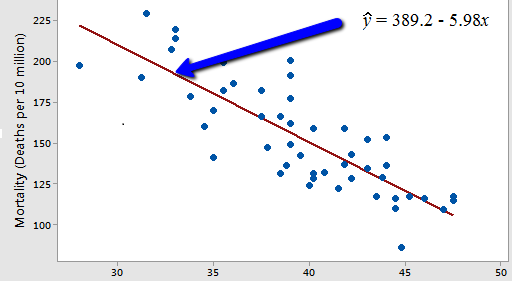
Skin cancer mortality rate vs latitude: onlinecourses.science.psu.edu/stat462/node/91/
The OpenLab is an open-source, digital platform designed to support teaching and learning at City Tech (New York City College of Technology), and to promote student and faculty engagement in the intellectual and social life of the college community.


I find Nadia’s graph extremely interesting. She did a great job analyzing and explaining how global warming is increasing as the years goes by. Each decade we see an enormous increase in climate change and it is affecting our earth. My suggestion to Nadia is what do you think is actually causing this increase in climate change? From 1901 to 1910 I see a degree in global temperature, what may be the cause of that? I know my questions require you to go above and beyond this graph but are it possible to assume that the main reason for global warming is our lifestyle now? or the chemicals we are using and technological advancement, like airplanes and toxic byproducts? What do you think is causing global warming to increase so rapidly?
Response to Javana’s questions:
What do you think is actually causing this increase in climate change?
-I believe that it is due to deforestation and due to more cars on the roads.
From 1901 to 1910 I see a degree in global temperature, what may be the cause of that?
-I believe it is because of the President at the time which was Theodore Roosevelt made laws to cut down on pollution.
Is possible to assume that the main reason for global warming is our lifestyle now? or the chemicals we are using and technological advancement, like airplanes and toxic byproducts?
-Yes all is a factor.
What do you think is causing global warming to increase so rapidly?
-I believe it is because we are using public transportation less which would lower the pollution because it is basically like carpooling. Also, we are quick to cut down trees to build houses