Summary
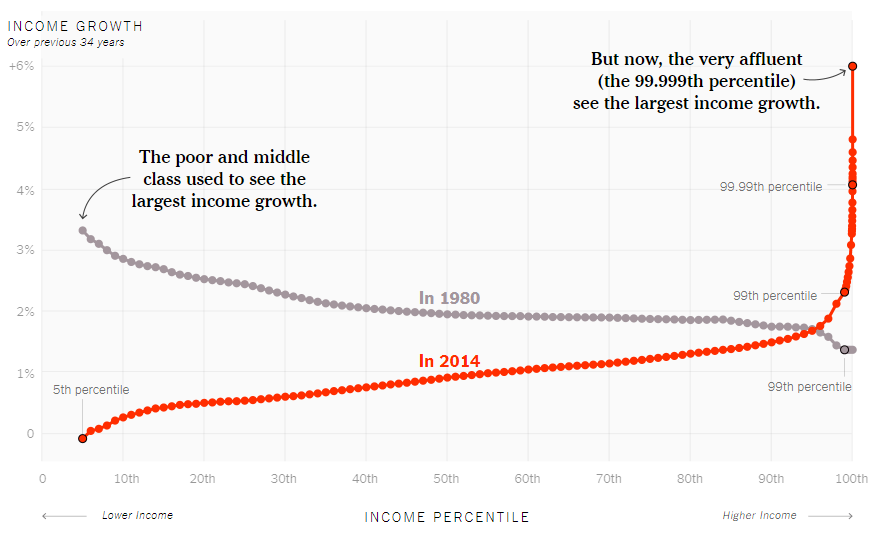
In this New York Times Article, “Our Broken Economy, in One simple Chart”, David Leonhardt explains how income growth is almost flat for the poor and middle class, but it seems to be skyrocketing for the top 1% of earners. The article is very interesting because Leonhardt not only exposes what is going on at the present moment, but also compares the current situation with the situation in 1980. The changes are shocking. In 1980, the poor and middle class used to see the largest income growth, but 34 years later, in 2014, the largest growth corresponds to the 99.99th percentile that happens to have a 6% income growth a year. At the moment, the 50th percentile has an income growth that is below 1%, which is not very promising.
The article is highly productive because it makes the reader reflect about why income distribution has changed drastically in the last four decades.
Graph
How the Graph was Used in this Article
The way the author used the graph in this article could not be better. The graph is a clear visual representation of the point that the author wants to make. By looking at the graph, it is easy to realize that income growth distribution changed drastically. The grey line represents income growth in 1980, and the red line represents income growth in 2014. It is easy to see how the grey line was decreasing, but the red line in increasing. Also, what catches the reader’s attention the most, it is how the red line skyrocketed in the 99.99th, which represent the very wealthy.
Link
https://www.nytimes.com/interactive/2017/08/07/opinion/leonhardt-income-inequality.html

