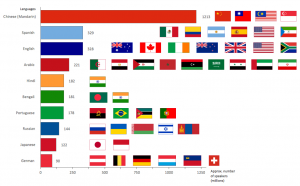
Bar graphs are very interesting because with them we can compare different topics with which we can get inform and learn how different we are. In this case this bar graph is about how many people speak a language and which is the most widely spoken.
Bar graphs are very interesting because with them we can compare different topics with which we can get inform and learn how different we are. In this case this bar graph is about how many people speak a language and which is the most widely spoken.
Posted in Uncategorized
Our goal is to make the OpenLab accessible for all users.
Our goal is to make the OpenLab accessible for all users.

