
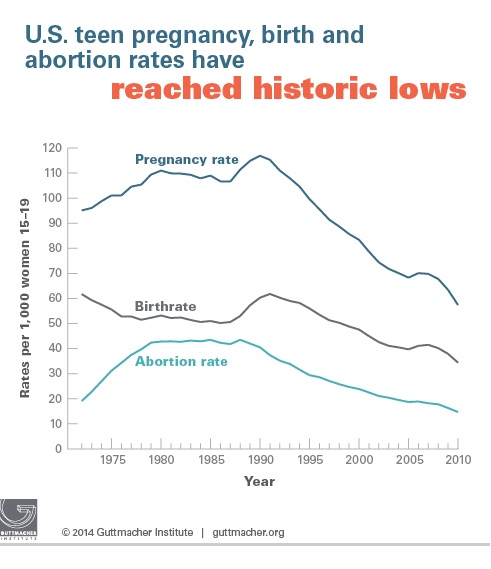
 This Line graph shows the rates of teen pregnancies, birth and abortion rates in the United States between the 1990’s and 2010 around the ages of 15-19. This line graphs shows the increase and decreases every 5 years for 1000 women between ages 15-19. Teen pregnancy hits its peak in 1991 at about 115,000 it slowly decreased about 45% later on.
According to the article in 2010, about 614,000 pregnancies occurred among teenagers 15–19, for a rate of 57.4 pregnancies per 1,000 women that age. That marked a 51% decline from the peak of 1990, and a 15% decline in two years, from 67.8 in 2008, according to “U.S. Teenage Pregnancies, Births and Abortions, 2010: National and State Trends by Age, Race and Ethnicity.


Reference? Also it looks like you copied and pasted. Do you need to put quotes? Do you have anything of your own to add? For instance, do you think that the trend will continue?
The reason it has a quotes is because I was quoting the article. I think the trend will continue, I believe that the rates for birth, pregnancies and abortion rates will decline. For the pregnancy rate it hit its highest peak in 1991 the lowest peak was 2005 over 14 year period. For the birth rate the highest was around 1991 also an decrease in 2005. A 14 year period which I feel the topic became something that was probably part of society then it was before. I believe that these rates will decline because now young girls have more resources where they can talk to someone, receive information and contraceptives to help them in their decision.
Ref:http://www.guttmacher.org/media/nr/2014/05/05/