You must be logged in to reply to this topic.
- Final Review Question 5
Viewing 3 posts - 1 through 3 (of 3 total)
You must be logged in to reply to this topic.
You must be logged in to reply to this topic.
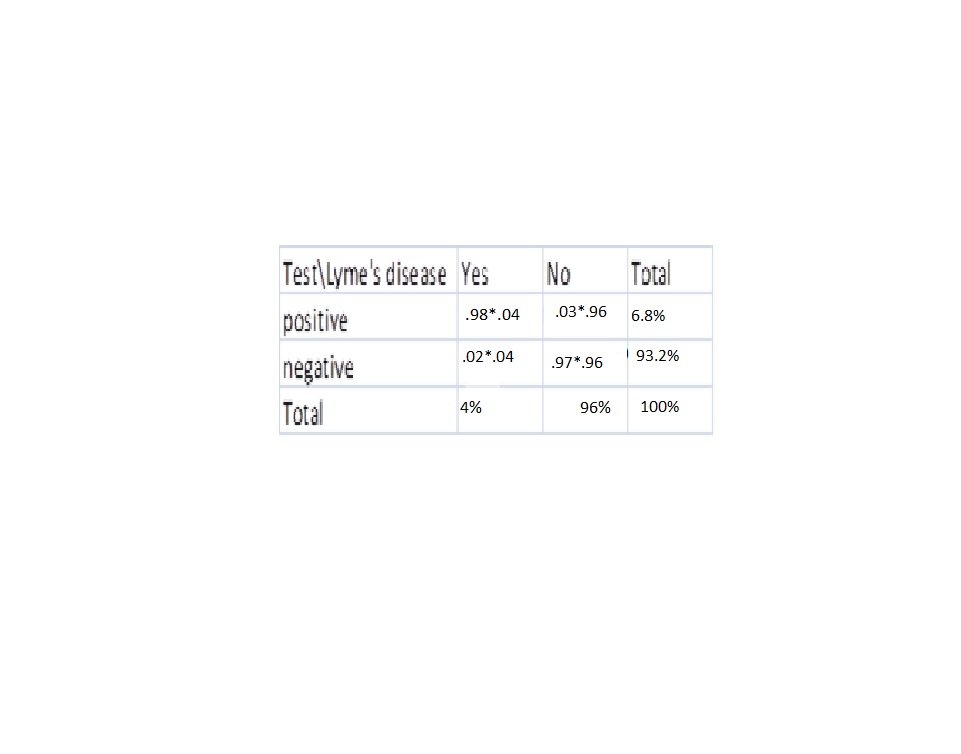
I’m having difficulties understanding what values to use in the chart…..
What chapter can this be found in the Book?
Not 100% sure if this is correct, but take a look and see if it make any sense to you.

A contingency table is a basic tool in statistics, just as a tree is a basic tool for probability. I take this as a criticism. In the future, I will make sure to spend more classtime explaining and using the tool. The book does discuss them in 13.3. There is also a short wikipedia page that you might take a peak at:
http://en.wikipedia.org/wiki/Contingency_table
Note that all of these use frequencies instead of the probabilities (decimals) that I used in class. But going from one to the other is not hard: divide each of the entries by the total number in the sample to convert to probabilities.
Ironically enough, I am using the “statistics” tool for a problem in probability. The material being tested by this question comes from chapter 4. In particular the vertical slash | refers to conditional probability.
You must be logged in to reply to this topic.
Ursula C. Schwerin Library
New York City College of Technology, C.U.N.Y
300 Jay Street, Library Building - 4th Floor
Our goal is to make the OpenLab accessible for all users.