

Contents
Molecular Genetics, PCR, and Genotyping
Background:
For the next three weeks we will be performing two molecular genetics experiments to introduce you to some commonly used laboratory techniques to assay genetic variation at the molecular level. All of these experiments rely on a technique called Polymerase chain reaction (PCR). PCR has revolutionized the study of genetics, helping to provide insight in a wide variety of disciplines ranging from medical genetics to ecology and evolutionary biology. The purpose of PCR is to exponentially amplify a specific gene or fragment of DNA, which is subsequently called an amplicon. Figure 1 highlights the generally procedure of PCR. Note that gloves are required throughout all phases of these experiments.
.")
The general procedure for PCR is as follows:
- Determine the fragment of DNA to be amplified. This is usually between 500-1000 bp.
- Design or obtain primers flanking the region of interest that are complementary to the template DNA. Primers are needed to ‘prime’ the reaction as DNA polymerase can only extend DNA in a 5’ – 3’ direction.
- Create a master mix containing all the needed reagents. Master mixes usually contain water, PCR buffer, dNTPs (nucleotides), both primers (forward and reverse), taq DNA polymerase, and the template DNA.
- Reactions are usually performed in a machine called a thermal cycler. Thermal cyclers automate the cycling of different temperatures that are needed to amplify the DNA. Multiple cycles are generally performed (e.g. 35), with each cycle consisting of three steps: denaturation (95 ºC), primer annealing (varies, generally between 50 ºC – 60 ºC), and extension (72 ºC). In addition, there is usually a final extension phase and an initial denaturation phase.
- When the PCR is complete, we can use gel electrophoresis to determine if the reaction worked. In many cases, we expect to see a single band in each well, particularly if we amplify a haploid locus (e.g. mtDNA, cpDNA). Conversely, in some cases individual alleles may be seen in a diploid marker, but this requires that the alleles are quite different in size and/or a polyacrylamide gel is used instead of agarose.
- The next step is to purify the PCR product to remove primers and unincorporated nucleotides. This can be done via spin column techniques or with enzymatic treatment.
- The purified PCR products can then be used for downstream applications such as direct DNA sequencing.
Lab overview and objectives:
Over the course of three weeks we will be performing two sets of experiments to introduce students to fundamental concepts in molecular genetics (Fig. 2). Upon completion of these labs students should be able to explain how restriction enzymes work, discuss what PCR is and how it is commonly used in molecular biology and genetics, understand why gel electrophoresis is performed, and demonstrate basic knowledge of Sanger sequencing and scoring of genetic polymorphisms.
Experiment A: PTC Genetics
As stated above, we will be performing two different experiments over the next three weeks. The first experiment focuses on the molecular genetics of a taste receptor found on the tongues of vertebrates. Many animals have specific taste receptors that help determine if a substance is bitter. This is often useful, as bitter substances are generally correlated with some level of toxicity. For this lab, we will be working with a synthetic, non-toxic chemical called phenylthiocarbamide (PTC) to mimic naturally occurring bitter compounds.
Humans can be classified along a spectrum of tasting ability for PTC. Some people detect a strong bitterness to the substance, whereas others taste nothing. The receptor protein is encoded by an autosomal gene called TAS2R38, which contains two common alleles and several uncommon variants. Differences in the two common alleles are due to a single nucleotide polymorphism (SNP) that changes one of the amino acids. The tasting allele, T, is thought as dominant to the non-tasting allele, t. Homozygous dominant (TT) individuals generally describe the taste as very bitter, heterozygotes (Tt) may detect mild bitterness, and homozygous recessive individuals (tt) will not detect any bitterness. Although many researchers treat the genetics of PTC tasting as a simple Mendelian trait (one gene, two alleles, complete dominance), the actual genetics is probably more complex involving many genes and also including an environmental component. Thus, the ability to taste PTC is likely a polygenic trait. Even at the single gene level (TAS2R38), there is no consensus as to whether the trait exhibits complete versus incomplete dominance.
Since having the tasting allele, T, would seem like a benefit due to an organism’s ability to detect potentially toxic compounds (and avoid or adapt to them), why has natural selection not removed the non-tasting allele, t, from populations? One reason might be balancing selection due to overdominance (heterozygote advantage). Balancing selection tends to maintain multiple alleles in a population. In the case of PTC, there may be some selective advantage of possessing the non-tasting allele in the heterozygote form (similar to the case of sickle-cell anemia). Clearly, more research needs to be conducted to determine the potential benefit of the non-tasting allele.
You will use PCR to amplify a 221 bp fragment of the PTC gene to determine the genotypes corresponding with the different phenotypes (tasting ability). Before beginning the molecular component of this lab we will quantify the phenotypes of the class in the table below. Each person should taste the control paper first to make sure no bitterness is detected.
Your PTC phenotype:______________
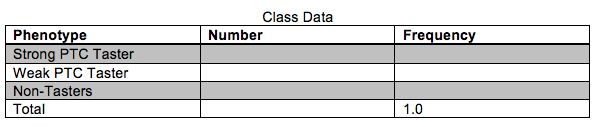
Based on the results in the table above, does it appear that PTC tasting ability follows simple Mendelian inheritance patterns? Explain your reasoning.
Procedure:
A general overview of the PTC laboratory procedure is depicted in Fig. 3. Note that allelic differences are due to a G-C polymorphism at base 145 that changes the amino acid from proline (taster) to alanine (non-taster). Use the gel diagram below to draw predicted banding patterns for each of the three digested genotypes and an undigested amplicon. The ladder well can be used to indicate bands of known size.

PTC Genetics Lab Schedule
Week 10 – DNA extraction from cheek cells, set-up PCRs and send amplicons for sequencing
Week 11 – Restriction enzyme digestion, gel electrophoresis
Week 12 – Lecture, data analysis, and review
Day One (Week 10) – Using Cytobrush to extract DNA from cheek cells
- Use sterile cytobrush and insert into mouth.
- Brush cytobrush on inside of cheek 25 times.
- Swirl cytobrush in 100 μl of Chelex suspension (10% w/v).
- Place centrifuge tube with Chelex and cell suspension on 100 °C heat block for 10 minutes.
- Centrifuge tubes at maximum speed for 5 minutes.
- DNA is in the supernatant (avoid beads at bottom).
- Store DNA in -20 °C.
Day One (Week 10) – PCR with PCR beads and DNA sequencing
- Add 22 μl of primer mix (forward, reverse and loading dye) to PCR tubes containing PCR beads.
Primers:
5’-CCTTCGTTTTCTTGGTGAATTTTTGGGATGTAGTGAAGAGGCGG-3’ (Forward Primer)
5′-AGGTTGGCTTGGTTTGCAATCATC-3′ (Reverse Primer)
- Ensure that the bead is dissolved.
- Add 3 μl of DNA.
- Load samples on the thermal cyclers and run the “PTC” program.
- Store amplified product at -20 °C until you are ready for the next stage of the experiment.
When the PCRs are complete, your instructor will send your amplicons for DNA sequencing using the Sanger sequencing technique. An overview of the Sanger method is provided in Fig. 4. Briefly, the PCR amplicon is combined with one of the primer sequences (forward or reverse), DNA polymerase, dNTPs and ddNTPs and cycled in a thermal cycler at certain conditions. During primer elongation, a ddNTP (instead of a dNTP) can become added to the growing sequence. The addition of a ddNTP causes termination of elongation, which is why Sanger sequencing is also called chain termination. Sequencing fragments are then separated by gel or capillary electrophoresis and a laser is able to differentiate between individual bases to produce an electropherogram. The reverse primer will be used for sequencing in this experiment.
.")
Day Two (Week 11) – Restriction enzyme digestion and gel electrophoresis
Our next goal is to setup restriction digests on the PCR products to quantify allelic polymorphisms. Recall that the recognition site for the HaeIII enzyme is GG|CC. In other words, the enzyme will only cut the DNA at these sequences.
Gel Casting (Gels will be used for both laboratory experiments [PTC and GMO])
- Each group of four (4) will prepare a 2% agarose gel.
- In a flask, combine 50 ml TBE buffer with 1 g agarose. Gently mix the solution.
- Microwave the buffer-agarose mixture at 30 sec intervals, mixing the solution between heating. Make sure you wear protective gloves as the flask will be hot! The agarose should be completely dissolved in the buffer and be clear.
- Add 10 ul SYBR Safe DNA stain to the hot flask and gently mix.
- Place two combs into each gel apparatus. Make sure the comb with 10 wells is placed facing down. Let the hot gel mixture cool a bit before pouring (~3 min). Carefully pour the gel into the gel tray, making sure that no liquid is spilled.
- Gels may be placed in the refrigerator to expedite solidification. This should take no more than 20 min.
DNA digestion
- Each student should obtain two new microcentrifuge tubes. Label one tube with your initials and the letter ‘U’ for undigested and one tube with the letter ‘D’ for digested.
- Transfer 5 ul of PCR product into tube labeled ‘U’ and 5 ul into tube labeled ‘D’.
- Add 1 ul of HaeIII enzyme to tube ‘D’.
- Briefly vortex or pipette-mix the mixture to homogenate.
- Incubate for 10 min at 37 °C.
- Save the remaining 15 ul of PCR product for DNA sequencing.
Gel electrophoresis
We will use gel electrophoresis to separate and visualize the DNA fragments resulting from digestion with the HaeIII restriction enzyme. Your goal is to compare the observed genotypes among individuals.
1. When adequately solidified, place gel in gel apparatus. Make sure that the wells of the gel are near the negative (black) electrode.
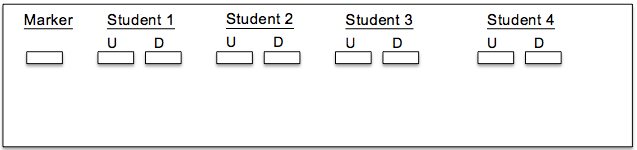
2. Each student should load two samples into the gel—one undigested sample and one digested with the restriction enzyme. Each gel should also include a DNA ladder (marker) to help size the fragments (load 5 ul of the DNA ladder). Below is a representative diagram of how the gels should be loaded for one group. U = undigested; D = digested.
3. Run gel for 20 min at 120 V.
4. Visualize results using transilluminator and obtain genotypes. Pay particular attention to your own banding pattern.
5. Use your smartphone to take a picture of your gel.
Day Three (Week 12) – Lecture, data analysis, and review questions
- Obtain your DNA sequence from your instructor and analyze it using the software FinchTV. Specifically, import the .ab1 files into the program. Use the chromatograms to edit the sequences (e.g. trim low quality bases from the beginning and end of reads). Low quality bases in the middle of sequences can be replaced by an ‘N’. Once the sequence has been edited, export it as a new .seq file. Take some time editing sequences from other students as well. What nucleotide is present at ~position 146? What does this indicate? Note that a heterozygous site is indicated by two peaks with relatively even intensity. Use Fig. 3 to help determine your genotype.
- Compare and contrast your DNA sequence to your banding pattern on your gel. Do both methods yield the same results? Can you unambiguously determine if you are homozygous or heterozygous?
Review questions:
1. Draw your banding patterns in the gel image below.

2. What is your genotype? How does your genotype correspond to your phenotype?
3. Are you homozygous or heterozygous? How do you know?
4. Fill-in the table below regarding observed genotypes for the entire class. How do the genotype frequencies compare with the phenotype frequencies documented in the previous table?
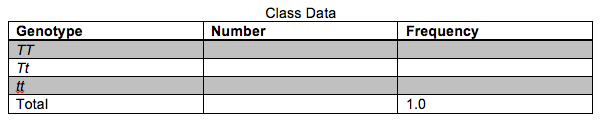
5. Use the information in the table to calculate the frequency of the two alleles.
6. Use the Hardy-Weinberg (HW) equation to determine if the class data deviate significantly from HW expectations. Remember that significance is often assessed by using the chi square test with 1 df (when using two alleles). The critical value according to the table is 3.841 using an alpha of 0.05. The HW formula is as follows:
p2 + 2pq + q2 = 1
p + q = 1
7. If diploid species possess two alleles per locus, how do you explain the banding patterns seen in the samples?
8. In your own words, discuss the benefits of possessing the tasting allele. After all, phenylthiocarbamide is not a naturally occurring compound. Why might the non-tasting allele be maintained in natural populations?
9. How do your genotyping results correspond to your DNA sequence? Remember that in this experiment the two alleles are distinguished by a G-C substitution at base ~146. What would you expect the sequence of a heterozygote to look like? Explain your reasoning.
10. Explain how restriction enzymes work and how HaeIII was able to discriminate between the tasting and non-tasting alleles.
11. Discuss how PCR works and how it can be used to clonally amplify specific fragments of DNA.
Experiment B: Genetically Modified Organisms (GMOs)
There is continual interest in the potential uses of genetically modified organisms (GMOs) to benefit both humans and natural ecosystems. This is particularly true with GMO crop species. By inserting foreign genetic material into species of agricultural importance, scientists can create strains that are pesticide- and herbicide-resistant, produce larger fruits, and exhibit particular nutrient composition in their species of interest. Unfortunately, creating GMO crops is an expensive and laborious process. Furthermore, there is considerable debate as to the pros and cons of creating GMOs. For example, opponents argue that GMOs will lead to the evolution of herbicide-resistant weeds and that there may be negative health outcomes from consuming GMO species.
The first step to create a GMO is to identify a gene and trait of interest. As an example, genes from the bacterium Bacillus thuringiensis are commonly inserted into crop species because many of these genes encode proteins that serve as a pesticide to certain insect species. Thus, farmers will not have to spray harmful (and carcinogenic) synthetic pesticides on crops, which may have a substantial influence on human health. The next step is to isolate, or clone, the gene of interest into a DNA vector. A DNA vector is a circular piece of DNA (usually a bacteria plasmid) that can be genetically engineered based on its proposed usage. In addition to cloning the gene of interest, other fragments of foreign DNA are also inserted into a vector. These include regulator sequences such as a 35S promoter region from the cauliflower mosaic virus (CaMV 35S) and a terminator region from the nopaline synthase (NOS) gene from the bacterium Agrobacterium tumefaciens. These regulatory elements are commonly used in GMOs to maintain high levels of gene expression in nearly all the cells of the plant. Next, researchers must find a way to introduce the foreign DNA into plant cells. It is generally not possible to transform all the cells of a grown plant. Instead, scientists isolate a few plant cells that will incorporate the exogenous DNA. Multiple techniques can be used for transformation including infection with bacterial species, using a ‘gene gun’ to bombard cells with the DNA, or using a technique called electroporation to create pores in plant cell membranes. Regardless of the technique, in order to be effective the foreign DNA must pass through the cell wall, plasma membrane, and nuclear membrane to be successfully incorporated inside the plant cell genome. The next step is to determine which plant cells have taken up the foreign DNA into their genome. To aid in this endeavor, additional selectable markers are often used. Finally, researchers will add hormones to the plant cells to stimulate cell division, which will eventually yield an entire plant composed of genetically modified cells.
For this lab exercise, you will test common grocery items to determine if they are genetically modified. Approximately 85% of GMOs contain either the CaMV 35S promoter or the NOS terminator sequence, both of which are ~200 bp long. Common GMOs in the United States include corn and soy-based products. In addition, many strains of papaya often contain GMO sequences that can be determined using molecular genetic techniques. Wheat and rice products are generally lacking genetic modification. Throughout this exercise, multiple controls will be used to make sure that the experiments runs adequately. This is explained in greater detail below.
As the molecular techniques in this exercise are similar to those used in the PTC genotyping lab, we will work on both exercises simultaneously over the course of three weeks (Weeks 10-12). The GMO lab will be divided as follows:
GMO Lab Schedule
Week 10 – DNA extraction from food samples and PCR
Week 11 – Gel casting and electrophoresis
Week 12 – Lecture, data analysis, and review
Day One (Week 10) – DNA extraction from food samples
You were asked to bring in food items from the grocery store to test for evidence of a GMO. A class of 16 should be divided into four groups of four. There should be enough supplies for each group to test a different food item.
- Obtain two 1.5ml microcentrifuge tubes. Label one as “non-GMO” and the second as your test food.
- Place a crumb of “non-GMO” (that comes with the lab) or your test food into the corresponding tube.
- Add 50 ul dH2O to each tube.
- Twist a clean plastic pestle against the inner surface of the tube for 1 min to forcefully grind the crumb. Be sure to use a different pestle for each sample.
- Add 300 ul of InstaGene matrix to each tube, pipette up and down a few times to homogenize the ground slurry with the InstaGene matrix.
- Place each tube (non-GMO control, test sample) in a dry bath and incubate for 5 min at 95 ºC.
- Place tubes in a microcentrifuge and spin for 5 min at maximum speed to separate the DNA, which will be in the supernatant following centrifugation.
Day One (Week 10) – Set-up PCRs
Following DNA extraction we will set-up our PCRs. Remember that we will be using PCR to determine if the CaMV 35S sequence is present that would indicate that the item has been genetically modified. Each of the four groups will set-up six (6) reactions. Use the following number scheme to label your tubes. Also be sure to include your initials, the date, and the lab section on the tubes. Make sure you use different pipette tips between samples! Also make sure that you do not disturb the InstaGene beads when transferring your DNA. When instructed, place your samples in the thermal cycler and your instructor will execute the program “GMO.”
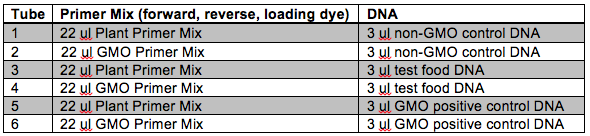
You will notice that each DNA sample is being amplified twice using two different master mixes, one plant and one GMO. The plant master mix contains primers that will amplify ~200 bp of a gene within the chloroplast DNA (cpDNA). Why do we include primers for this gene? This helps us to guard against false negative results. For example, we would be fairly confident that a food item did not contain GMO sequences if no bands were detected using the GMO primers, but the cpDNA band was detected. Conversely, if no bands were detected with either master mix we cannot be entirely confident in our results that the item is non-GMO. The lack of bands with both master mixes might be due to a poor DNA extraction.
Looking at the table, can you provide a reason why we are including non-GMO control DNA in the experiment? How does this make the experiment more reliable?
You will also notice that our DNA samples contain a GMO positive control. Discuss why this is useful to our experiment. If the GMO positive control yielded no bands with the GMO master mix, what might you conclude?
In general, why is it useful to include multiple controls when performing molecular genetic experiments? How might this influence the diagnosis of various human diseases?
Day Two (Week 11) – Gel casting and electrophoresis
This week we will be performing gel electrophoresis to determine the banding patterns of your food samples to determine if any are genetically modified. Remember, about 85% of GMOs will possess the CaMV 35S sequence, which is ~200 bp in length. The cpDNA gene is also ~200 bp.
Gel Casting
1. See directions above for PTC exercise. Each group’s gel will contain samples from the PTC exercise AND the GMO exercise!
Gel electrophoresis
-
- Place gel into the electrophoresis chamber. Make sure there is enough 1X TBE buffer to cover to gel.
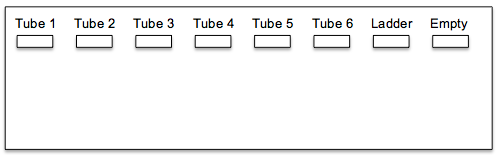
- Load 20 ul of each PCR sample (and 5 ul of the DNA ladder) into the gels following the diagram below. Refer to the table above for tube-sample correspondence.
- Run gel for 20 min at 120 V.
- Visualize results using transilluminator and obtain genotypes.
- Use your smartphone to take a picture of your gel.
Day Three (Week 12) – Lecture, data analysis, and review questions
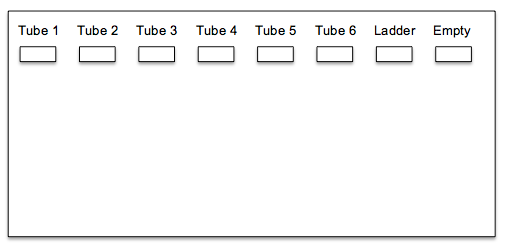
- Draw your group’s banding patterns obtained following gel electrophoresis in the image below.
Review questions:
- Why did we include primers to amplify a cpDNA gene in this experiment?
- Which foods tested showed signs of GMOs?
- Why were 3% gels used in the GMO experiment?
- How were you able to determine that a food sample contained GMOs?
- Suppose you tested a food item that you knew was genetically modified, but the results of this experiment were negative. How might you explain the results?
- Plant cells have how many genomes? What are they? Which genomes were examined in this study?
- Why did your instructor recommend that the non-GMO food control sample be prepared using the mortar and pestle prior to the test food sample?
- What reagents are used in a typical PCR? What is the function of each component?
- Explain why DNA ladders are usually included during gel electrophoresis.
- One aspect of PCR that can be modified is the annealing temperature. In general, higher annealing temperatures show more specificity towards a single template, whereas lower annealing temperatures show less specificity and may bind to multiple regions throughout the genome. Discuss how using an annealing temperature that is too high or too low might influence the results of a PCR assay (and gel electrophoresis results) such as the one used in this study.

